I can sample in real time up to 10Gs/sec, that is 500,000 samples per 20KHz cycle, would that be good enough for our dear petr_2009? 
I would think it's time for him to yet again shift his moving target to nowhere.
Hans, don't hold your breath waiting for instructions, we still need you around 😀.
I would think it's time for him to yet again shift his moving target to nowhere.
Hans, don't hold your breath waiting for instructions, we still need you around 😀.
Speed (velocity) distortion occurs at any deviation of the signal from the sinusoid of a given frequency. In this case, the burst is passed through a 100 kHz low-pass filter.
Hans, to begin with, measure the second error of your amplifier at a frequency of 10 kHz, otherwise some authors with 30 years of experience strained with this
"Now, please post the link to the article with the noise intermodulation test, the one where the tube amp got a high score. That's interesting. "
журнал "Радио" 1999-04 page 29
Attachments

Last edited:
A simple task for those who want to demonstrate the omnipotence of their laboratory based on a sound card. It turns out that some can measure the delay of signals even up to a picosecond.
A task:
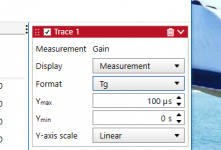
measure and show the Gdelay graph of your amplifier from 5 kHz to 5 MHz.
A task:
measure and show the Gdelay graph of your amplifier from 5 kHz to 5 MHz.
nonlinear distortion...any deviation of the signal from the sinusoid of a given frequency
linear "distortion", 5 times over audioband.. Speaker box or your ears are also "LP filter"..the burst is passed through a 100 kHz low-pass filter.
Why is it interesting? You are superbat or dolphin? 🙂 But in simulation it is no problem even to 100MHz 😉show the Gdelay graph of your amplifier from 5 kHz to 5 MHz.
Delay and LP filtering ( way over audioband) are not distortions
Last edited:
Link - Wikipedia"Now, please post the link to the article with the noise intermodulation test, the one where the tube amp got a high score. That's interesting. "
журнал "Радио" 1999-04 page 29
I’m out of popcorn
This is …. a pinnacle!
Petr, in the whole history of your trolling at diyaudio, you have never ever shown any your measurement. Just simulations.
Do you know that simulations and real circuit results could be very different? Do you?
In your "native" 😀 language: 당신은 당신의 완전한 무지에 한심합니다
A task:
measure and show the Gdelay graph of your amplifier from 5 kHz to 5 MHz.
This is …. a pinnacle!
Petr, in the whole history of your trolling at diyaudio, you have never ever shown any your measurement. Just simulations.
Do you know that simulations and real circuit results could be very different? Do you?
In your "native" 😀 language: 당신은 당신의 완전한 무지에 한심합니다
Here's the link
Стр. 29 журнала <<Радио>> № 4 за 1999 год
Machine translation
What he says about signal probability density is interesting, it's similar to GedLee metric. Also similar to what I've been doing in the output stage measurement topic.
However, it seems the amps clipped during measurements, which means the results measure clipping behavior more than any other stuff. That's sad, because in normal hifi use an amp should rarely (if ever) clip. The technique is interesting though. I might try it.
Стр. 29 журнала <<Радио>> № 4 за 1999 год
Machine translation
Opinions and discussions
MEASUREMENT OF NONLINEAR
DISTORTION ON THE NOISE SIGNAL
A. SYRITSO, Moscow
In the article, the author draws the readers ' attention to one practically unused method of measuring the nonlinearity of forces. The results of objective measurements of nonlinear distortions of the
UMZCH using this method surprisingly coincide with the results of their subjective assessments during expert listening. It would be interesting to know the opinion of amateurs and
specialists about the applicability and distribution of such a method of measurements in electroacoustic equipment. If readers show interest in the proposed publication,
we will tell you about the main nodes of this meter.
The well-known methods for measuring nonlinear distortions in sound transmission paths are very diverse [1, 2]. The harmonics method is widely used as the simplest in experiments and convenient for calculations. Other methods are less common: difference tone, modulated tone, mutual modulation (intermodulation). Transient intermodulation disturbances are also measured. The listed methods have their own areas of application. At the same time, each of them uses special signals that provide the greatest efficiency.-reduction of distortion products.
However, this is the reason for their low informativeness regarding the integral assessment
of distortions introduced into the sound path and significantly affecting the subjective (expert)
evaluation of the quality of transmission of real audio signals.
The visibility of nonlinear distortions of a real signal is related to how often, if we consider the
process in time, or with what probability, if we apply a statistical measure to it, its instantaneous values fall into the region of significant non-linearity of the sound transmission path.
Many people probably had to observe how when the signal level decreases in an overloaded channel, the sound hoarseness disappears. The smaller it is, the less often the signal emissions fall into the overload area.
Typical feature of the function The transmission of the signal s in the sound transmission path is shown in Fig. 1, a. Here: the input and output signals are normalized in power; W (s) the probability density of instantaneous values of the signal s,... The section A corresponds to a relatively small nonlinearity, and the sections B are large. For convenience of analysis, Fig. 1, b shows the boundaries of the probability density distribution W (s) of the instantaneous values of two
signals of the same power: white (Gaussian) noise (curve 2) and harmonic (curve 1). As follows from Fig. 1. a, all the values of the input signal, limited by the function W (S) for the sine wave, fall on the section of the transmission characteristic with a smaller nel-while for a noise
signal 16 % of the time, its values are found in areas of the transmission characteristic with a large nonlinearity. It is clear that the noise signal is subjected to significantly greater distortions
than the sinusoidal one.
In [3], the results of studies of the probability density of the measured values of signals of natural
sounds (speech and music) are presented. They turned out to be much closer to the noise signal in their level distribution than to the harmonic signal.
Consequently, the estimation of nonlinear distortions based on the methods listed above-
For example, it gives incorrect ideas about the actual nonlinear distortions of real signals.
Less well-known measurement methods using noise signals are much more informative
[1, 2, 4 – 9]. One of the methods [4] is used in cinematography and television to
measure nonlinear distortions of the phonographic phonogram [5].
The structural scheme of the measurement and the spectral diagrams for this method are shown in Fig. 2. The measuring The ISM signal is generated by the white noise generator GBSH. limited by a bandpass filter PF by a band frequencies of 3 ... 12 kHz, which is fed to the input of the OI measurement object.
Products of non-linear distortions.
The STPs (intermodulation) of the noise signal from 1 kHz are measured with a voltmeter V
after the LPF with a weighting in the frequency band of 30 Hz... 1.2 kHz. The numerical indicator of non-linearity is the ratio, expressed in decibels, of the mean-square distortion of distortion products (Uc) to the distortion of the reference signal (Ub) generated by a generator built into the device with a frequency of 1 kHz: Kish = 20log (U./Up). (1)
The described measurement method is implemented in the 7E-67 device and is successfully used
in film studios. On television, a similar device is the INIF meter. Distortion measurements are also carried out by the harmonic method using a measuring signal in the form of a third -
octave noise band [5 – 9].
The structural scheme and spectral diagrams are shown in Fig. 3.
From the generated generator
For the study of the object of OI measurements, the bands are alternately isolated by the pink noise block of the FFT bandpass filters, and a decrease in the level of 3 dB per octavus is provided by an increase in frequency- it provides a constant power of the measuring signal in any third-octave
band.
From the products of distortion of the signal voltage U, only harmonics U2, U3 located in the third - octave bands with average frequencies pf,, where = 2, 3..., f, the average frequency of the measuring signal band are taken into account.
The measurements are carried out by an analyzer of the AC spectrum connected to the output of the measuring object. The numerical indicator of the harmonic coefficient of the noise signal is determined by the formula (U3+ U3+ ... 0.5 /U, - 100 %. (2)
It should be taken into account that the reliability of measurements with this method is-
it depends on the limitation of the transmission of the measurement object. There are other, more complex measurement methods using noise signals. A wide application of the GSH FFT
According to the authors, the use of such signals during measurements in sound equipment
is hindered by a number of factors: the reliability and high cost of equipment for analyzing random signals. the need to revise standards (for example, the output power in amplifiers), and the inertia of thinking of many engineers who are accustomed to sine signals.
For a practical assessment of the effectiveness of the use of noise signals, the author carried out comparative measurements of nonlinear distortions in several UMZF according to the standard
method (the harmonic method) and on a noise signal using the device 7E-67 at the same values of
the overload of the amplifiers. For the tests, various UMZPS were selected in terms of circuitry
and element base, designed for voicing large values (power of 100 W or more. all models had
overload indicators). In addition, subjective quality assessments were also carried out
(COK) sound reproduction on a decimal scale.
The results of testing the nonlinearity of the amplifiers are shown in the table.
Power amplifiers 1-4-transistor with different feedback depth (A), 5 - tube amplifier.
The table shows the values of the coef-the ratio of harmonics to, at a frequency of 1 kHz
and the noise intermodulation coefficient according to the device 7E-67.
High level of distortion in transistor amplifiers with a deep common OOS in the measurement of nonlinearity Shu-movim signal due to the fact that measuring the signal in the noise has a high crest factor and contains a wide range of frequencies, co-sdusa a wider range distortion products, and a significant the difference in attitude Kg/Kish for all amplifiers increase intermode-
translational distortion when crackower-a temporary overload. From the table it follows
that the UMZCH with a greater depth of OOS they also have a great attitude Ks/Kish, receiving, respectively, new JUICE points.
As a result of the tests, the following conclusions can be drawn:
1. The control of nonlinear distortions on a noise signal has a significantly greater informative value, allows us to approach a subjective assessment of the quality of sound reproduction.
2. When designing all the links of the sound transmission path, one should strive not only to reduce
the harmonic coefficient, but also the noise intermodulation coefficient.
The described method is initially intended for measuring the nonlinearity of the phonographic
phonogram of film films (when controlling the quality of the technological process of their replication), therefore, with regard to measurements in high – quality sound transmission paths, including loudspeakers, it is advisable to correct the measuring signal band.
LITERATURE
1. Rakovsky V. V. Measurements in the apparatus for recording the sound of films. - Moscow:
Iskusstvo, 1962, pp. 336-353
2. Ishutkin Yu. M., Rakovsky V. V.
Measurements in the equipment for recording and reproducing the sound of films. - Moscow: Iskusstvo. 1985, p. 28-41.
3. Shitov A.V., Belkin B. G. Statistical characteristics of signals representing natural sounds and their application in the study of electroacoustic systems. - Proceedings of the NIKFI, issue 56, 1976.
4. Rakovsky V. V. Method of measuring nonlinear distortions in a photographic transverse phonogram. Auth. Svid. No. 136573 (1960) - BI, 1961, No. 5.
5. RTM 19-17-72. Movies 35 and 16 mm. Technological regulations of the compensatory
method of recording negatives, photographic processing, printing positives and
monitoring the quality of photographic phonograms. - Moscow: NIKFI, 1972.
6. Penkov G. In the top of the measurement, the signal is random and stationary on the non - line of the occurrence. The measurement is based on the non-linearity of the distortion, the tape is clear from the normal noise. - Izvestiya na NIIKRA, vol. 6. - Sofia, 1966.
7. Zhuravlev V. M. Method of measuring non-linear distortions using noise bands Cand. diss. LIKI, 1967.
8. Belkin B. G., BorkA. A. The relation between the coefficients of nonlinear distortions measured on noise and sinusoidal signals. - Film and Television technology, 1968. No. 7.
9. GOST 16122-78. Speakers Methods of electroacoustic tests,
From the editorial office.
Noise measurement
The intermodulations of the UMZCH for professional purposes differ in this case in that this equipment is often used to the maximum power, long - term overload.
In comparison with tube amplifiers, the maximum current limit is often more
pronounced in transient amplifiers under overload, which corresponds to a sharp
increase in nonlinear distortions. In the UMZCH used in the home environment,
the signal restriction mode is practically not achieved with the correct selected power, so it is advisable to consider the option of using a method with a limit level restriction the noise signal. At the same time, the difference between amplifiers with different element bases is likely
to decrease significantly. In addition, it should be taken into account that there are still a number of critical parameters - the frequency band, phase and transition characteristics, the level of self-
noise…
What he says about signal probability density is interesting, it's similar to GedLee metric. Also similar to what I've been doing in the output stage measurement topic.
However, it seems the amps clipped during measurements, which means the results measure clipping behavior more than any other stuff. That's sad, because in normal hifi use an amp should rarely (if ever) clip. The technique is interesting though. I might try it.
A simple task for those who want to demonstrate the omnipotence of their laboratory based on a sound card. It turns out that some can measure the delay of signals even up to a picosecond.
A task:
measure and show the Gdelay graph of your amplifier from 5 kHz to 5 MHz.
I used the soundcard to acquire LRCK at the SPDIF transmitter and LRCK at the SPDIF receiver. Phase shift between these two gives the delay (and its variations known as "jitter") introduced by the SPDIF chain. Then I used a divider to do the same with sender MCLK vs receiver recovered MCLK. It was around 25MHz, so that's 5x more than the 5MHz you asked 😀
1ps is 0.000017° phase shift on a 48kHz signal, which is measurable with a soundcard if noise is low enough.
For the group delay of an amp I would use the network analyzer, but that's not an interesting measurement: open loop phase shift is much more interesting for stability.
The Bode100 in my soundcard-based lab 😎 would measure group delay directly, but I have never bothered to measure it in amplifiers. With electronics-based group delays several orders of magnitude below that of the acoustical part of the reproduction chain, who would bother?
Jan
Jan
Attachments
Last edited:
Petr,Speed (velocity) distortion occurs at any deviation of the signal from the sinusoid of a given frequency. In this case, the burst is passed through a 100 kHz low-pass filter.
Hans, to begin with, measure the second error of your amplifier at a frequency of 10 kHz, otherwise some authors with 30 years of experience strained with this
"Now, please post the link to the article with the noise intermodulation test, the one where the tube amp got a high score. That's interesting. "
журнал "Радио" 1999-04 page 29
I need a more precise definition of what to do that really makes sense.
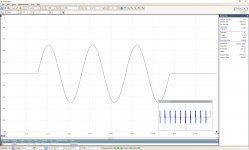
It is easy to generate a three cycle sine wave at 10Khz with 1000 point per cycle and offering this to an amp, see image below.
And also subtracting input from output after gain correction is easy to perform, although rather questionable other than to show that there is a difference between the two.
But then comes the third step which is subtracting the input signal from the (gain + delay) corrected output signal.
And here comes my question:
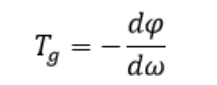
Do you use a fixed value for this time delay, then it makes no sense at all because GD depends on frequency.
Especially at the start and end of the 3 cycle sinewave, there is a wild spread of frequencies, so you will have to restrict the input signal to a frequency band where the Amp's GD is constant.
Not doing that will give an outcome that can't be used for any prove of distortion.
Hans
P.S. I asked for a link or a copy of the test in #632, but none of both was given.
I just saw that PeuFeu gave the link.
.
Attachments
Last edited:
A simple task for those who want to demonstrate the omnipotence of their laboratory based on a sound card. It turns out that some can measure the delay of signals even up to a picosecond.
A task:
measure and show the Gdelay graph of your amplifier from 5 kHz to 5 MHz.
No problem at all with the VNA software using the same Picoscope.
Everything up to 100Mhz will be a hit of a button, but what's the point, why are you asking ?
Is this to have an excuse why you are never measuring anything at all ?
Hans
Thx for supplying the link + translation.Here's the link
Стр. 29 журнала <<Радио>> № 4 за 1999 год
What he says about signal probability density is interesting, it's similar to GedLee metric. Also similar to what I've been doing in the output stage measurement topic.
However, it seems the amps clipped during measurements, which means the results measure clipping behavior more than any other stuff. That's sad, because in normal hifi use an amp should rarely (if ever) clip. The technique is interesting though. I might try it.
The clipping issue is rather masking the results, however I'm anxious to see any results from your side.
Hans
Apparently it is worth repeating again - you have function breaks in the places you are talking about. And at the same time, a signal with a wide spectrum is received at the input of the amplifier, which is not limited by anything, since you do not put additional filters in the simulator.orjan, I repeat again: velocity distortions occur mainly at the very beginning of the first period, as well as with changes in frequency and amplitude, even with an ideally constant GDT. This is why there is a big difference between tests using noise-like signals (pink noise) and multi-tone tests.
of course, we are talking about the first period of the sinusoidal signal.
Explain how noise-like signals differ from multi-tone ones in your opinion? The waveforms of a multi-tone signal were given above in the topic and it looks quite noise-like. I know the answer, but I want to hear your version so that we can compare where the difference is hidden.
Note that even in the Syritso article, the white noise signal was limited to a bandpass filter. And in the same way, the obtained difference components were usually filtered to isolate the part of the signal that falls into the sound range (or, in general, into the operating range of the device under test). Thus, no one tries to evaluate the results in the entire spectral axis, since this is not necessary.
No, I don't think so. I have not tried to prick you personally anywhere, but you persistently turn to personalities and express your hostile attitude. My questions and theses are strictly within the framework of the topic discussed here. If you are not satisfied with my answers to your personal attacks, then maybe you should not make them? Behave with dignity, including with the rest of the forum participants, and then the communication will be much more neutral and even pleasant, despite the possible previous negative experience.fagos, your flood has already got me, don't you think you're acting mean?
The clipping issue is rather masking the results, however I'm anxious to see any results from your side.
Yes, it's pretty sad.
I think I will try it if I have time. My "two sinewaves" test can pinpoint a trouble spot according to output current, so if something happens when one device turns off, there is a blip on the curve at exactly that spot. That's very useful. But the drawback is that noise floor is pretty high because it is equivalent to stepping DC voltage and doing a FFT run for each point, which means the number of samples in each bin has to be low otherwise it takes forever.
The noise test from the article has the opposite advantages and drawbacks.
I like the fact that its signal spends more time around zero, just like normal music. I tweaked my signal from the beginning to do that also.
BTW We have also touched upon acoustic measurements using a sound card and REW. Just found out that there is a TI app note describing just that: https://www.ti.com/lit/an/slaa641/slaa641.pdf
They use my favorite, a Scarlet Focusrite 2i2 in some of the measurements. To drive the speaker they use a TPA3116D2 eval module.
Worth a read.
Jan
They use my favorite, a Scarlet Focusrite 2i2 in some of the measurements. To drive the speaker they use a TPA3116D2 eval module.
Worth a read.
Jan
Last edited:
A simple task for those who want to demonstrate the omnipotence of their laboratory based on a sound card. It turns out that some can measure the delay of signals even up to a picosecond.
A task:
measure and show the Gdelay graph of your amplifier from 6Khz to 5 Mhz.
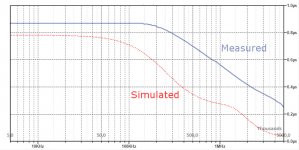
Just out of curiosity I did both a Sim and a real measurement of my Amplifier's GD from 5 Khz to 5 Mhz.
It's obvious that those two curves are not the same, so simulations are helpful but not always perfect.
GD is apparently constant up to just ca. 150Khz.
So subtracting a (gain+10Khz delay) corrected output from a sudden starting and stopping input signal, that's going way beyond 150Khz, will produce the sort of non-sense pictures with so called "Speed Errors".
Not shown here, but after offering a 100Khz limited input signal composed of just three 10Khz cycles and then subtracting it from time and gain corrected output, resulted as expected in a flat line !
Hans
.
Attachments
Hans, your measurements showed a latency of 875 ns. Clarifying question:
Is it with or without RF input filter?
If the result is with a filter, then if not difficult to do the same without an RF input filter.
Is it with or without RF input filter?
If the result is with a filter, then if not difficult to do the same without an RF input filter.
No input filters and everything from in to out completely DC coupled.
Some details:
Two 0dB gain Opa627 input buffers are driving the 600R inputs of a 27dB gain differential amplifier.
Hans
Some details:
Two 0dB gain Opa627 input buffers are driving the 600R inputs of a 27dB gain differential amplifier.
Hans
- Home
- Amplifiers
- Solid State
- Musings on amp design... a thread split