Now it is relatively easy to correct the upper mids and highs, even with just a few support points.
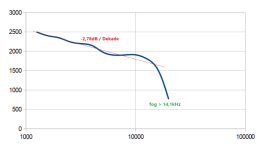
But what is obvious (and we already know that the equalization of the Supra-EQ is quite remarkable)? That I have not terminated the AT VM95C correctly, fh is too low at 14k142Hz (and it looks like a first order filter).
So I still have some work to do.
regards,
HBt.
Outlook:
After (finally) I have found the correct complex load for this MM system, a final measurement with the sweep on the ORTOFON test LP will follow.
Digitally recorded and analyzed - please be patient.
Let's move on to the next round

The right channel, outer flank of the groove!
The MM system is now terminated with <150kOhm. Whereby the results at the end with <47kOhm up to 1kHz are completely undisputed and can be considered reliable with the extremely small, relative deviations to RIAA-de emphase. The totally primitive setup for data recording is remarkable.
From 1k6Hz it gets worse, but why, that is the question here.
If you keep an eye on HiFi-DIN, everything is still perfectly in the green zone. Nevertheless, one can safely assume that fh shifts to the right and is now close to 19kHz. However, there is no longer a termination with a Q of less than or equal to 1. Nevertheless, I have corrected for 1st order just for fun.

The story continues ...
tbc
The right channel, outer flank of the groove!
The MM system is now terminated with <150kOhm. Whereby the results at the end with <47kOhm up to 1kHz are completely undisputed and can be considered reliable with the extremely small, relative deviations to RIAA-de emphase. The totally primitive setup for data recording is remarkable.
From 1k6Hz it gets worse, but why, that is the question here.
If you keep an eye on HiFi-DIN, everything is still perfectly in the green zone. Nevertheless, one can safely assume that fh shifts to the right and is now close to 19kHz. However, there is no longer a termination with a Q of less than or equal to 1. Nevertheless, I have corrected for 1st order just for fun.
The story continues ...
tbc
The left channel, inner flank of the groove!

The third, offset column represents the groove cut without EQ, i.e. linear. It should also be noted that the modulation represents a mono signal. This means that each edge contains the same information.
One should also consider the measurement requirements for the measuring range and the TrueRMS converter in a band from 20Hz to 20000Hz. Actually, if we leave the typical measuring range of 200mV, we need a measuring amplifier! The low voltage values should therefore be viewed with reservations - at the moment (almost only) the trend is important. The limitations of the vinyl, the groove, the falling radius and the constant circular speed of 33.333 rpm are completely ignored in the current test.

The sixth column of the table represents the correct transfer factor (related to the reference frequency of 1kHz), our target, the actual RIAA-EQ with the known time constants. Overwritten with “Norm”.
The appendage attempts to perform a very simple correction with the presumed upper cut-off frequency of the MM system (but as first order, i.e. Q<1).
#
Up to the 18th row (1kHz) we can read that the cut is extremely accurate to the equalization specification, extremely ... everything above that should be treated with a little caution, but we can still do a lot with the data points obtained.
tbc
The third, offset column represents the groove cut without EQ, i.e. linear. It should also be noted that the modulation represents a mono signal. This means that each edge contains the same information.
One should also consider the measurement requirements for the measuring range and the TrueRMS converter in a band from 20Hz to 20000Hz. Actually, if we leave the typical measuring range of 200mV, we need a measuring amplifier! The low voltage values should therefore be viewed with reservations - at the moment (almost only) the trend is important. The limitations of the vinyl, the groove, the falling radius and the constant circular speed of 33.333 rpm are completely ignored in the current test.
The sixth column of the table represents the correct transfer factor (related to the reference frequency of 1kHz), our target, the actual RIAA-EQ with the known time constants. Overwritten with “Norm”.
The appendage attempts to perform a very simple correction with the presumed upper cut-off frequency of the MM system (but as first order, i.e. Q<1).
#
Up to the 18th row (1kHz) we can read that the cut is extremely accurate to the equalization specification, extremely ... everything above that should be treated with a little caution, but we can still do a lot with the data points obtained.
tbc
tbc
And now the long overdue correction of the "second part of the measurement".

You can clearly see the precision with which the VMS80 machine - and Daniel Krieger (from SST Brüggemann GmbH) cut the test LP. However, above 12k5Hz a filter (or filter mechanism) of unknown type seems to be in effect.
This finding is completely independent of our MM system and correct or incorrect termination. Either a treble adjustment has been made or, more likely, it is a mechanical effect that is directly related to the speed of the stylus relative to the different radii; the maximum permissible groove deflection is known to decrease steadily from 1kHz (for the inner flank, the outer flank looks somewhat different).
We start at 140mm (RIAA on) and end at 120mm. Now we continue (RIAA off) to 95mm - approximately. Always in two columns, 20Hz to 1000Hz and 1000Hz to 20kHz, with levels adjusted for each. But the reference level (on average it should be approximately the same across the radius) increases on average with a smaller radius.
tbc
As a reminder,
the recording amplifier (which is not a measuring amplifier) is Supra24 with Ruby3.
SST Brüggemann GmbH
kindly,
HBt.

the recording amplifier (which is not a measuring amplifier) is Supra24 with Ruby3.
SST Brüggemann GmbH
kindly,
HBt.

The last excursus was not about getting to grips with the "Supra24 & Ruby3 circuit", but about remembering the classic measuring chain and, above all, other things:
to get to know the test record!
We already know the equalizer set up here (with its core, an alternative component dimensioning compared to the original and all would-be derivatives) inside out thanks to the simulations; elaborate electrical measurements are a luxury in this context. Extensive measurements and evaluations (not interpretations, but evaluations) are only for the developer - of interest. Or a sales company, which naturally has to provide specifications, i.e. technical data.
My aim was to reveal a core, a dimensioning in connection with the annoying (and addressing) topic of noise. What exactly one do with this building block was not my intention or concern - but open to any diy-people.
#
Now a new, interesting, controversial topic has popped up in various parallel threads: namely the question of the electrical modeling of a typical MM pickup.
For professional reasons, I am interested in the exact procedure of a well-known USER. Absolutely not the model, because that is really trivial, but the method of determination.
Let's leave aside everything professional (the measurement technology and the methodical, scientific work) and just ask about the excitation signal. We need to excite the DUT appropriately and record its response to this excitation. The pickup (the DUT) must therefore be perfectly adjusted in its optimum working condition, i.e. placed in the groove of a test record. If one want to do the excitation in this way!
Even for the electrical impedance (real and imaginary parts) determination, the pickup should be mounted, perfectly adjusted and placed in the groove. Of course, it doesn't hurt to make a comparison between offset and non-offset, i.e. free - and of course you also do this because you want to see how the positioning (under working conditions) of the small permanent magnets in the gap affects the magnetic flux (the density), quite practically. But now you have a big problem with the measuring leads ...
Another thought that was expressed carelessly about the excitation signal:
if we do not want to record the resulting system behavior or the entire behavior of the system statically, i.e. always in a steady state, but dynamically and atok, then we need a suitable signal that can correctly map and excite the frequency range from exactly 1kHz to 20kHz in a short (but sufficiently long) sequence. We are happy to extend the detection range by one octave at a time, so a signal (which is not yet fully defined) that now has a bandwidth of 40kHz minus 500Hz must also be able to be cut.
Now I'll address (@Hans Polak) it directly:
Dear Mr. Polak,
would you please explain your special method for indirectly determining system behavior for modeling in detail, step by step, in full and openly.
Perhaps you could use the inexpensive AT VM95 system, each with the three different styli. Or Ortofon's well-known series, which almost every supplier of turntables now uses.
Cool and a big thank you in advance,
HBt.
Psst
Let's open a new thread about this.
I have no idea what you want to know on top of all what’s been extensively written in my DiyAudio posting and in a further publication in the december’s AudioXpress issue.
You have to be a lot more specific.
Hans
You have to be a lot more specific.
Hans
Last edited:
Rectification
The quote used by Mr. Polak referred to a personal attack against a blameless user - I wanted to support this user.@hbtaudio I don't follow Mr. Polak's comments, they were all completely unnecessary (and perhaps a little malicious).
Published by you in another thread.
Is this your way to get information from someone ?
Hans
No problem, because this topic is honestly pretty boring at this level.I have no idea what you want to know on top of all what’s been extensively written in my DiyAudio posting
I think it would be an exaggeration to be even more specific in this place. Let's put the issue to rest now and not contaminate this thread as well, I can wait patiently until the December issue this year.and in a further publication in the december’s AudioXpress issue.
You have to be a lot more specific.
Hans
That's all.
Bye,
HBt.
One don't have to wait at all - Mr. Polak meant the current print edition - we just have to buy it.And diving into a powerful exploration of the world of phono cartridges, Hans Polak writes about the Individual Transfer Curves of Moving Magnet Cartridge Subassemblies. A Moving Magnet (MM) phono cartridge can be characterized by its overall transfer function. But the transfer function of the part that generates the signal through magnetic induction has its own transfer function, which can also be measured. By translating the latter into an equivalent electronic circuit, further insight and possibilities for optimization can be obtained. Hans Polak explains.
Okay,
I apologize for the inconvenience ... sorry.
HBt.
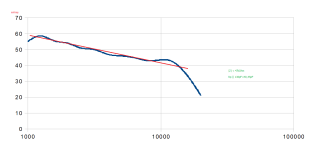
Back to the topic and let's take the second column from 1kHz to 20kHz single frequencies:
Related to the reference level at the beginning and end of the track, freq = 1kHz,
Have a good guess, the system is still the cheapest MM on the market, AT VM95C,
HBt.
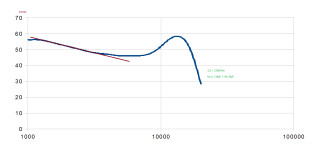
Related to the reference level at the beginning and end of the track, freq = 1kHz,
- there is an approximate constant downward trend of -2.893dB/decade
- there is now an approximate falling tendency with -0.828dB/octave, followed by a low-pass behavior with a Q > 1.
Have a good guess, the system is still the cheapest MM on the market, AT VM95C,
HBt.
Attachments
The big question is always:
can the light blue area (below the superelevation) fill up the "bathtub"?
And the answer is:
Yes.
Which MM system termination is the correct one?
Or to put it another way, how do I get more energy out of the top without it actually being there? Well, one have to stimulate another resonance circuit.
Correctly terminated, practically, every simple MM ends above 15kHz - and this already means a 1/sqrt(2) limit.
The storage medium limits us in the needle tone process by itself. A 15kHz sine wave requires a length of 34µm at the beginning of the large disk for one period and 12µm at the end - and that with groove speeds of 50.6cm/sec or 17.4cm/sec.
The speed of the moving diamond at 1kHz is approx. 8cm/sec in order to induce an original voltage according to DIN 45547, which corresponds to the full scale.
So it all depends on the instantaneous diameter and the permissible limiting deflection at a given frequency of a sinusoidal oscillation.
Incidentally, the ride of our diamond is pure madness in terms of force or better expressed as pressure on the groove flanks - with a groove width of approx. 40µm with perhaps rounding of the diamond of 15µm (an ellipse or other cuts is of course better) - you can happily assume 100bar as the pressure equivalent.
The mechanical challenges are very high if we want to break the 15 kHz barrier. We must not forget that there is a speed for / to voltage conversion.
HBt.
Attachments

All guessing or good estimation is not enough for a reference point. At least a simple electrical series model of the magnetic pickup is needed.
A good half hour later,
the simplified (but completely adequate) model is available and confirms the previously estimated conclusion. Of course, this requires at least a few electrical specifications (measurements) and the manufacturer's data sheet.
From the manufacturer's technical data I take the upper frequency limit and read 20kHz, at the same time the rounding radius of the diamond with 15.24µm, glued on a fat aluminum cantilever ... So all in all, I'm sure you can't get more than 15kHz out of this, rather less.
tbc
Attachments
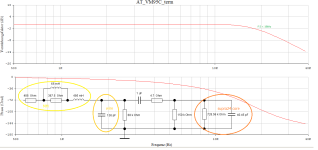
It is easy to quickly insert the upper limit specified by mechanics, by physics - this is the result.

It is possible that something may occur above the band from 15kHz to 30kHz due to unwanted resonance effects, but (it is) dirt and no useful signal - i.e. interference.
HBt.
It is possible that something may occur above the band from 15kHz to 30kHz due to unwanted resonance effects, but (it is) dirt and no useful signal - i.e. interference.
HBt.
A final result, terminated as shown in post #195.
This time I used a measuring amplifier and an AC-DC converter and of course Supra24 plus Ruby3 (right channel). I'll spare us all the raw data set.
MM:
No words - what a load of crap. It's just as well that old men can't hear anything up there anyway. But we can still hear the important upper mids very well - even the insane distortions of these cheap systems.
Attachments
For the vertical axis should also a logarithmic or dB scale be used.
This will give a much better and more realistic impression of the cart’s behaviour.
Our auditory system doesn’t follow a linear level law but a logarithmic one.
Same for frequency.
Hans
This will give a much better and more realistic impression of the cart’s behaviour.
Our auditory system doesn’t follow a linear level law but a logarithmic one.
Same for frequency.
Hans
If we can assume that exactly this track was cut on the test record in such a way that a credible conclusion can be drawn about the transmission behavior of the tactile sensor, then there is only one answer to the constantly falling transmission level /factor.
Friction and “the spring”, i.e. the (movable) suspension of the stylus /cantilever fitted with a rubber damper (at the end). Of course, the spring constant is frequency-dependent; the spring becomes harder or, in other words, less compliant with rapid changes in position.
You can intuitively assume that.
HBt.
Psst
You have no choice but to repeat the measurements countless times and compare each time with a known reference, i.e. repeat and repeat with a very good MC ..!
The compliance is of course a point in the manufacturer's data sheet - static 0.17µm/dyne & dynamic 0.065µm/dyne.
The abscissa is plotted logarithmically as usual, while I have plotted the ordinate linearly, also as usual.
I could submit this right away if it helps?
At the moment it's not about what we might hear - and the “we hear logarithmically” narrative is not entirely correct either, but it's another exciting topic (worth its own thread).
kindly,
HBt.
For the vertical axis should also a logarithmic or dB scale be used.
This will give a much better and more realistic impression of the cart’s behaviour.
Our auditory system doesn’t follow a linear level law but a logarithmic one.
Same for frequency.
I could submit this right away if it helps?
At the moment it's not about what we might hear - and the “we hear logarithmically” narrative is not entirely correct either, but it's another exciting topic (worth its own thread).
kindly,
HBt.
- Home
- Source & Line
- Analogue Source
- MM-EQ; the SUPRA2024