How is it rude for someone to say they do not like how you communicate? Is the rule "agree with gedlee = polite, disagree with gedlee = impolite"?He said:
"I also have to say that I do not like how he communicate with forum members. "
which is both rude and unnecessary since it did nothing to elucidate his argument.
You apparently don't find it rude for you to repeatedly criticise the ARTA software on a public forum based on no more than glancing at other people's plots, nor apparently do you feel there is any need for you to make the slightest effort to establish whether your criticisms have any basis in fact.
I could live with ARTA as the main data taking software, but not their polar maps, because I don't think that they are right.
Below is the result. Not bad I'd say. Certainly better than ARTA would do with a 13 degree average spacing (180 / 14).
it is not my obligation to read a manual for a piece of software that I do not use.
We have already seen how your data is incorrect at 18 angles.
ARTA data always looks better to me than what I get - that makes me suspicious, but I have no more data than that on which to base an opinion.
Nor you do feel any compunction to apologise when someone does the work you cannot be bothered to do that shows ARTA and your software produce very similar results.
Bolserst Thanks for those plots. Not as different as I expected. Perhaps the ARTA stuff that I had seen in the past was heavily smoothed by the user rather by default in the software. I would have had no way of knowing which. But I have almost never seen an ARTA map as detailed as what is shown in your left hand plot. All of the real warts are there even if they aren't exactly the same. I think my technique works a little better near the 10 kHz point, but that is to be expected. But they are not so different that it would worry me.
For the record, I have looked in some detail at the measurement results ARTA produces and have always found them very accurate, and the author helpfully explains the methods he uses to process the data to aid with interpretation of the results.
Happily, we can always count on you to be entirely civil in responding to people.
Go waste your money on renting or building an anechoic chamber if that makes you happy.
A little introspection probably wouldn't go amiss.
Perhaps you have some valid points. The fact is that I never said anything that was wrong, I only had suspicions based on seeing what were overly smoothed plots. Apparently this was because people choose to smooth them so much - rather than being a flaw in the software it was a flaw in the user. 1/3 octave should never be used in polar maps and should not even be an option.
And there are differences in our plots and mine have been show to be the more accurate in a difficult situation. I do not have ARTA so I could not do these comparisons.
I resented from the beginning turning this into a competition of techniques. That is not what this thread is about. It is about the need for people to have access to real data so that they can see for themselves what is right and what is wrong. I don't care what software is used that is irrelevant. I do care if it is a burden to people to have to buy it and expensive test stands etc. Whatever is used must be inexpensive and simple to use.
I am quickly coming to the conclusion that people are just not interested in this idea and all they really want to do is argue about "who is better". I am not interested in that and perhaps I should just withdraw my offer.
Hello Earl;
I am keenly interested in this but don't quite know how to participate.
I like the idea of getting as much of this quantified and out of the subjective domain as possible and to be able to do it in 14? measurements is pretty incredible. This looks like a very efficient method, nearly everything in one picture, like a Nyquist plot.
Here's where I'm at, I don't have Holm and don't have the time to learn a new measurement platform. I have lightly perused ARTA but don't have it nor have I learned it. I have and am reasonably proficient with TEF. I have the Polar module and a hanging rotating platform but haven't used it in years and currently have no polar data files. I can and will gladly get that set back up if it's possible to use the data files it generates.
I don't know what a data file from Holm or ARTA looks like to compare it to TEF and of course don't expect you to know what one from TEF looks like but I will ask, do you think that me using what I have could work with what you are doing? If not how should we find out?
You stated something like since this is a DIY forum that few would supply measurements of commercially available speaker systems for comparison. I have many of the large format JBL studio monitors and a pair of 1400 Arrays that I would be delighted to take and submit measurements of for comparison, if it's possible to do with what I know and own.
This really depends on if using my known platform is usable. Any ideas?
I would like to participate
Thank you,
Barry.
Hi Barry
Thanks for your interest.
From what I remember about TEF it is basically a swept frequency measurement that does not result in an impulse response - it uses a heterodyne sort of detector, more an analog type of measurement. It might be possible to derive an impulse response from it and this may actually be done in its implementation, but I don't know.
Rewriting my code to take different formats of impulse responses is not a huge problem, but I really do need the data in impulse response format in a common time base. There are no options to that. I would be willing to rewrite my code to accept a different format if this were going to happen once, but I am not interested in doing this for everyone who want me to use a different format.
So if TEF will output impulse response then maybe I'll consider using its output. If you could send me a file containing several impulse responses then I could take a look at it. But my concern here would be that TEF is simply an obsolete measurement platform and no one else is likely to be using it. Modern software, even the free stuff, is much better than TEF (assuming what I have used in the past is what you are talking about). Multiple studies of techniques has proven that log swept sine is the most robust of all the techniques.
I would hope that you would look at using some other software that had a more modern implementation. Which software I really don't care as long as it can produce multiple impulse responses in a common time base. From what I can tell this is not really very common.
PS. I used to use a technique that involved the analysis in only real numbers, i.e. magnitude responses. When I went to fully complex calculations the resolution of higher frequencies and off axis was improved. Hence, the techniques will work without time synchronized impulses, but if we want the best resolution possible then proper phase of the off axis measurements is required and proper phase requires a common time base.
Earl,So if TEF will output impulse response then maybe I'll consider using its output. If you could send me a file containing several impulse responses then I could take a look at it. But my concern here would be that TEF is simply an obsolete measurement platform and no one else is likely to be using it.
Pat Brown, president of Synergetic Audio Concepts (Syn-Aud-Con) Inc. and Electro-Acoustic Testing Company (ETC) Inc. has used TEF since the 1980s.
B&C uses TEF for loudspeaker testing, as does Danley Sound Labs.
It can do all the measurements you require.
Art
Attachments

I am quickly coming to the conclusion that people are just not interested in this idea and all they really want to do is argue about "who is better". I am not interested in that and perhaps I should just withdraw my offer.
I think part of the problem may be that this thread was started with a white paper covering your plotting technique. The polar map database seemed a secondary topic. But your comment makes me think that the database was your main topic, and the plotting technique you use secondary. Personally, I am interested in both understanding/experimenting with your modal technique and the polar map database.
I think everybody would agree that a database of polar maps for comparison of existing/older production speakers as well as DIY efforts would be a valuable set of measurements to have access to. Would you still be interested in developing the database if your modal technique was not the basis for the polar maps?
It is clear that with a good set of 14 measurements, your technique can provide accurate higher resolution polar maps than simple interpolation. But it requires proper time synch of the measurements, proper positioning of the center of rotation, and there may be potential round off errors with low signal level data.
PS. I used to use a technique that involved the analysis in only real numbers, i.e. magnitude responses. When I went to fully complex calculations the resolution of higher frequencies and off axis was improved. Hence, the techniques will work without time synchronized impulses, but if we want the best resolution possible then proper phase of the off axis measurements is required and proper phase requires a common time base.
Would your older magnitude based analysis (although lower resolution) produce more consistent results with varying quality of data? Do you consider it better than simple interpolation? If so, and you still have it working, you could try running the _Wim_ data thru it and see if the questionable lobes are present in the polar map.
To borrow your words from post#125:
“Lets not make "being perfect" be the enemy of "being good". We need what works satisfactorily not what is perfect.”
If we can get more datasets added to a database for comparison in a consistent manner using simple interpolation with 19 measurements(0 - 90 every 5 degrees)would that be better than using a potentially higher resolution method that (due to data requirements) would have fewer entrees? Considering the effort put into your modal technique, I am guessing you feel that higher resolution than 5deg is really needed if one expects to draw useful conclusions from comparing polar maps and listening impressions. I don't have enough experience yet to have an informed opinion...I'm pretty new to polar mapping loudspeaker responses.
I am quickly coming to the conclusion that people are just not interested in this idea and all they really want to do is argue about "who is better". I am not interested in that and perhaps I should just withdraw my offer.
From my perspective reading the white paper, I felt that I really needed a lot of free time to get everything set up (hell, I usually need a good deal of free time just to get the mic setup etc).
Just be patient - I know a lot of us are interested, but as DIY is merely a hobby, we're going to procrastinate.
What better way to procrastinate than argue about who is better? 😱
Hi Art
A couple of points. I would not be surprised if TEF could do what is required internally. The question is will it export something useable. Without an actual file to examine I cannot answer that question.
Having spent a couple of years working with B&C I can say with certainty that they do not use TEF. They use AP. Maybe they used to use TEF, but not since I have worked with them.
And lets not loose site of intent here. TEF was never a poor mans measurement system. The idea here is low cost simplicity. TEF does not really fit that requirement I don't think.
Bolserst
My main intent is the database not my modal technique. I have no problem with using a lessor resolution technique, but then that opens the door to the "apples to oranges" problem. I would also like to point out that only with my technique can I give you the DI and power response, which I personally find critical. To get those I must use impulse responses and not just frequency responses. I have no problem using the "real only" option where required as long as the plots noted on them that this was the case and that the results would then be compromised.
How to make all this happen I have no idea, but I am quickly loosing interest as it sounds like a lot of work for me to make this work for others. I did not envision that when I started. It all works so well for me. I thought that all the work that I had done thus far would mean that others would do the work required on their end to meet me where I am. That does not seem to be working.
What better way to procrastinate than argue about who is better? 😱
Sure, but just expect me to ignore it because I have no interest in that.
Well, somebody at the B&C Speaker Lab measured a cabinet with TEF on 1/6/10. B&C posts quite a number of cabinet plans that use TEF measurements.Having spent a couple of years working with B&C I can say with certainty that they do not use TEF.
Of course, who used what when still does not answer whether TEF can export something useable to you.
Attachments
I am still very interested in the database also, especially if we can get some commercial speaker in there also.
A good way to do this would be a combined effort. If your software would accept ARTA txt files, and my software would be available to the public (need to start writing some code...), then it would be possible to measure polar plots in less than 3 minutes with 14 angles. Setup is still some work, but the way I envision it is "hifi get to gathers". Once set-up, a new polar can be taken every 5 minutes (2 minutes to set the speaker on the stand and connect the amplifier). Everybody can bring his or her speaker if desired, and in a single evening a lot of data could be collected.
I still am looking for the reason of the unexplained lobes also. The following things I already checked:
- micro-phone preamp => work oks (checked with measurement capacitor in loopback)
- problem with holm export and Belgium "regional settings" in windows (we use point and comma differently than in the US) => points are used in holm export which is OK I think
- problem with sound card on measurement PC => compared with other card I got, works identical
I will re-measure my speaker also using the higher gain pre-amp I have, just have to wait until I am home alone to clear the living room... 🙂
Art
I only worked in the anechoic chamber and that used AP. It could also be that someone else did those measurements since I never saw a cabinet shop at B&C.
I only worked in the anechoic chamber and that used AP. It could also be that someone else did those measurements since I never saw a cabinet shop at B&C.
I am still very interested in the database also, especially if we can get some commercial speaker in there also.
A good way to do this would be a combined effort. If your software would accept ARTA txt files, and my software would be available to the public (need to start writing some code...), then it would be possible to measure polar plots in less than 3 minutes with 14 angles. Setup is still some work, but the way I envision it is "hifi get to gathers". Once set-up, a new polar can be taken every 5 minutes (2 minutes to set the speaker on the stand and connect the amplifier). Everybody can bring his or her speaker if desired, and in a single evening a lot of data could be collected.
I still am looking for the reason of the unexplained lobes also. The following things I already checked:
- micro-phone preamp => work oks (checked with measurement capacitor in loopback)
- problem with holm export and Belgium "regional settings" in windows (we use point and comma differently than in the US) => points are used in holm export which is OK I think
- problem with sound card on measurement PC => compared with other card I got, works identical
I will re-measure my speaker also using the higher gain pre-amp I have, just have to wait until I am home alone to clear the living room... 🙂
I thought ARTA would not export an array of impulse responses? That is kind of a minimum requirement for usefulness. I am not going to deal with 14 separate files and names on my end. But maybe someone else would write some code that could combine the separate files into one of the correct format.
As I said before, once setup I did about 25 speakers in one day, 1/2 day actually. Setup is long, everything else goes quickly.
And remember to rotate closer to the speakers baffle, about 15 cm back from the baffle.
Last edited:
That would work fine for a speaker with an acoustic center 15 cm back from the baffle, but not so well for any speaker varying from that, unless I'm missing something different about your test procedure (which is likely).And remember to rotate closer to the speakers baffle, about 15 cm back from the baffle.
What would you suggest as a rotational center when measuring devices which have a frequency dependent variable acoustic center, like pinched throat constant directivity horns?
Hi Art
Normally I would say that it really doesn't matter much. I had not previously been very fastidious about what the rotation center was and have not seen any problems. And then I got _Wim_s data. Clearly something is wrong and I have no idea what it could be. He has one of my waveguides, which I have measured hundreds of times and yet his results are dramatically different than mine. Mine never vary even slightly. I test every speaker that I send out and see no variation in the least - and if there is then I fix it. I have never been suspicious of the measurement technique. It has been rock solid through numerous sound card and preamp changes over the years.
That is why I suggested to _Wim_ to rotate about the same point where I rotate about.
The underlying model to my calculations is that we have a source in the surface of a sphere. The center of the sphere is the origin not the moving source itself. So "acoustic center" really has no meaning here. At least not in its usual context.
I am going to go back to the lessor accurate phase blind techniques and see if they work better on _Wim_s data.
I guess I don't really understand if right now data from any old speaker is helpful (aside from the owner's interest)? I could pretty easily throw an active monitor on a stand sometime soon and do this, if that's the idea. If it's only supposed to be DIY projects we care about, it won't be so soon. How much clean impulse are you looking for again?
Last edited:
Earl,
In your white paper on the polar plotting and mode fitting, you mention the following:
I am really interested in the above statement. You may or may not know, but I have been developing my active crossover designer tools to include multi-axis simulation of the loudspeaker and crossover based on multi-axis measurements of the response of each driver in-box, sans crossover. The idea is to be able to view the multi-axis response in cartesian or polar coordinates while designing and tweaking the crossover.
The plot data is generated from the measurements plus the electrical crossover transfer function. The model of the loudspeaker's response is mapped into a large array in Excel and then exported. Any text data can be used to create the data array. I then use GNUplot to create the plot from the exported array data. The polar version of the multi-axis response plot looks something like the following:
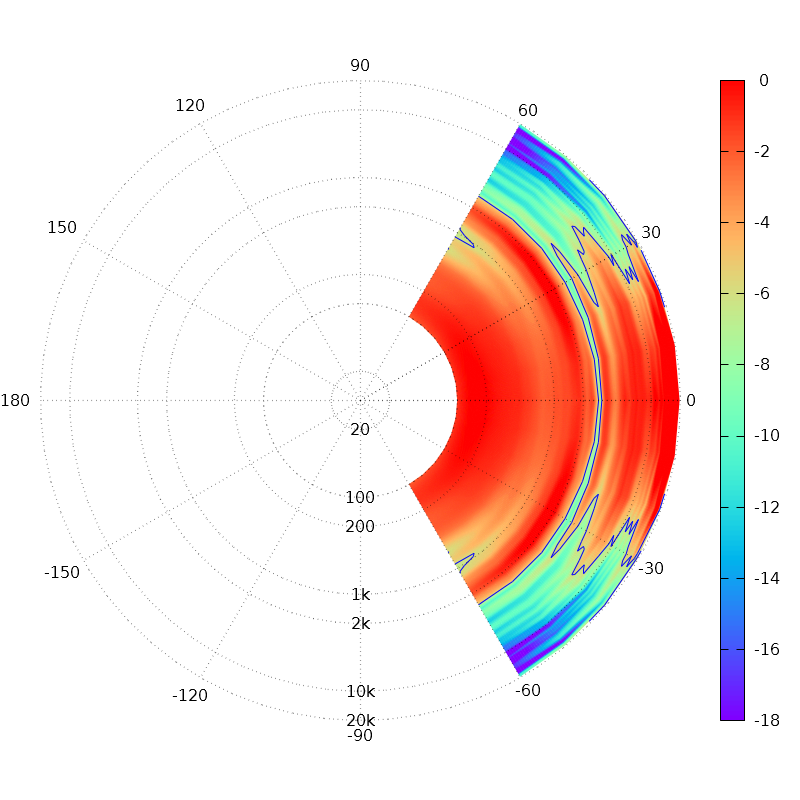
The above was done using only a limited range of angles in the horizontal plane, but can be extended as far "around" as desired.
Because of the quote from your whitepaper, above, I'm now concerned that this will be of little use because nulls in the input data will be washed out or will "vanish". I'd like to be aware of the limitations of my efforts... Can you expand on this claim a bit? Is this just resulting from averaging that goes on when interpolating the data? If so, that should be somewhat method specific.
Thanks,
-Charlie
In your white paper on the polar plotting and mode fitting, you mention the following:
It is well known that polar data cannot be interpolated between angles because nulls tend to move location in frequency as the angle is changed. Interpolating this effect simply smears it out of existence. The software that will be used here is free from this defect.
I am really interested in the above statement. You may or may not know, but I have been developing my active crossover designer tools to include multi-axis simulation of the loudspeaker and crossover based on multi-axis measurements of the response of each driver in-box, sans crossover. The idea is to be able to view the multi-axis response in cartesian or polar coordinates while designing and tweaking the crossover.
The plot data is generated from the measurements plus the electrical crossover transfer function. The model of the loudspeaker's response is mapped into a large array in Excel and then exported. Any text data can be used to create the data array. I then use GNUplot to create the plot from the exported array data. The polar version of the multi-axis response plot looks something like the following:
The above was done using only a limited range of angles in the horizontal plane, but can be extended as far "around" as desired.
Because of the quote from your whitepaper, above, I'm now concerned that this will be of little use because nulls in the input data will be washed out or will "vanish". I'd like to be aware of the limitations of my efforts... Can you expand on this claim a bit? Is this just resulting from averaging that goes on when interpolating the data? If so, that should be somewhat method specific.
Thanks,
-Charlie
Dumptruck
Personally I would be interested in any speaker. They are all examples of what certain designs lead to. That said, when we did a bunch of speakers here, they were all pretty bad. Some I would call broken, others just poor design. You don't learn much from either of those examples.
I have confirmed that when I use the complex number code that timing issues can create fallacious effects like we saw in _Wim_s data. Some of my older data where I was not so concerned with timing does the same thing. When the timing is correct there isn't a problem.
Charlie
My polar maps are just your plots unrolled. You can then do any angle limits without any problem. They may not give the same visual perspective, but I find that I quickly got over that issue.
The above statement applies very much to your situation. The reason that I did the complex number calculations was that I have a crossover modeling program just like what you are proposing. The one place that this model initially had trouble (matching reality) was right at crossover where the phase is critical. That's why I converted the code to do fully complex calculations. Hence, you have to have the complex calculations if you hope to put together two or more speakers. But it is not a huge effect for a full system.
The lobbing errors that you will get with interpolation depend on how deep the lobes are and how wide your spacing is. You can always do a finer spacing, in pro they require 2 degrees. If there are no lobes, such as with some waveguides, then there isn't an issue, but you don't know that going in. How the data is interpolated is really everything, except that you cannot interpolate a null when you don't have enough data to predict it.
Last edited:
It's much better to plot polar data using... a polar plot! Much better than a rectangular plot of polar data, since that will warp the info much like a Mercator projection warps the size of land masses in the extreme northern and southern latitudes.Charlie
My polar maps are just your plots unrolled. You can then do any angle limits without any problem. They may not give the same visual perspective, but I find that I quickly got over that issue.
Its not a proposed program, it's been around for a couple of years now. See:The above statement applies very much to your situation. The reason that I did the complex number calculations was that I have a crossover modeling program just like what you are proposing.
the Active Crossover Designer web page
Perhaps this is not the same kind of thing that you are talking about?
The one place that this model initially had trouble (matching reality) was right at crossover where the phase is critical. That's why I converted the code to do fully complex calculations. Hence, you have to have the complex calculations if you hope to put together two or more speakers. But it is not a huge effect for a full system.
Are you saying that you model more than one loudspeaker at a time in the same space? Hmmm interesting. Why do that? Was this, for instance, for the studies you did on on distributed multiple subwoofers?
I fully understand that interpolation is a smoothing operation for the most part. You can not "interpolate" data that you do not include in the interpolation, e.g. a null when no null existed in the input data.The lobbing errors that you will get with interpolation depend on how deep the lobes are and how wide your spacing is. You can always do a finer spacing, in pro they require 2 degrees. If there are no lobes, such as with some waveguides, then there isn't an issue, but you don't know that going in. How the data is interpolated is really everything, except that you cannot interpolate a null when you don't have enough data to predict it.
I don't follow you.. With Earl's plots, as you rotate around the speaker by some fixed increment, you move the reading on the y-axis by the corresponding fixed increment. Where's the warp? On your plot above, sure the angles are shown as actual angles around a pole, but since r = freq., the graphic doesn't directly map onto reality; cramming the lower frequencies into smaller areas close to the pole doesn't represent anything real. This seems like the warped version to me.It's much better to plot polar data using... a polar plot! Much better than a rectangular plot of polar data, since that will warp the info much like a Mercator projection warps the size of land masses in the extreme northern and southern latitudes.
Thanks for your sim software efforts, btw.
- Status
- Not open for further replies.
- Home
- Loudspeakers
- Multi-Way
- Measurement technology