Evidence of what? I still don't know what point is being made?I guess what @Hörnli wants to do is gather a wider range of evidence
One of the prime changes with current drive has to do with how the resonance changes, and that is precisely the area that is not shown!
Jan
Clearly the OP doesn't know the best way of getting what he wants. But current drive measurements are always welcome.
The OP only wants one thing, and I don't agree with his methods, but it is also the thing I want.
The OP only wants one thing, and I don't agree with his methods, but it is also the thing I want.
It takes a thief to catch a thief, meaning “no one is better at finding a wrongdoer than another wrongdoer.” First recorded in 1665, it remains current.
It's actually quite simple: I was bored out of my mind about fruitless discussions about transducer distortion mechanisms, and shorting rings...
...until i realized my own difficulties performing meaningful measurements.
...until i realized my own difficulties performing meaningful measurements.
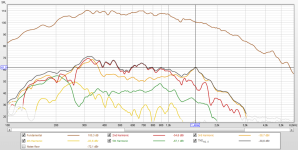
Here is the Tymphany SDS-160F25PR01-08 in a Boston Acoustics A40 bookshelf speaker box. I carefully EQd the SPL difference out so all frequencies are at 2.83V stimulus. This is nearfield and the harmonics are normalized to the response at the harmonic frequency to produce a chart that reflects the harmonics present at the voicecoil. REW file is attached so you can view the data any way you want.


Attachments
Interesting that you see an increased distortion below 100 Hz (besides the expected distortion decrease at higher frequencies).
Yes, it looks like the trend is lower distortion at midrange, a bit higher at the low- and high end.
Another thing I noticed is that at higher frequencies, there is something that lookes like an oscillation (white curve).
It is seen in all graphs to some extend, more with 20R drive.
I don't think it is oscillation (where would the energy come from), but what causes it?
Any ideas?
Jan
Another thing I noticed is that at higher frequencies, there is something that lookes like an oscillation (white curve).
It is seen in all graphs to some extend, more with 20R drive.
I don't think it is oscillation (where would the energy come from), but what causes it?
Any ideas?
Jan
Interesting that you see an increased distortion below 100 Hz (besides the expected distortion decrease at higher frequencies).
Yes, that is what you would expect with the suspension and motor designed to work together in voltage drive. To adapt the woofer to current drive then might mean using a much lighter suspension with the same motor. But then the suspension is no longer limiting excursion. So if we limit it by shortening the voicecoil we get back to the distortion where we started at.
I thought it was interesting that the M-165 woofer has less distortion in voltage drive than the SDS160 in current drive, at 3db higher SPL. Only thing is the SDS160 has a better step response. I'm surprised no one here seems to talk about or use GR woofers.
Another thing I noticed is that at higher frequencies, there is something that lookes like an oscillation (white curve).
The wiggle in the white curve is due to harmonics are reaching the end of the measurement BW at the same time as they reach the end of the woofer BW, so the noise floor gets normalized and then dropped as the frequency gets too high.
Note that the distortion improvement in the highs is less than pure current drive because with woofer inductance, the nonlinear driver impedance is approaching 20 ohms in the treble.Yes, it looks like the trend is lower distortion at midrange, a bit higher at the low- and high end.
Exactly! The more local feedback applied by using the back-EMF the lesser the impact of a progressive nonlinear suspension. OTOH, with current drive you need both a linear motor and a linear suspension.Yes, that is what you would expect with the suspension and motor designed to work together in voltage drive. To adapt the woofer to current drive then might mean using a much lighter suspension with the same motor. But then the suspension is no longer limiting excursion. So if we limit it by shortening the voicecoil we get back to the distortion where we started at.
With some compression drivers the effect can be quite drastic. CDs typically have a very linear motor (underhung, shorting ring or saturated gap) and hence have very linear back-EMF.
The suspension, though, is very progressive to strictly limit max excursion. Often, it's just a flat annular ring suspension made from aluminum, titanium, Kapton and the like.
Strong local feedback (with negative drive impedance even) helps a lot at the low end of the passband for large excursions. At some point you literally slam into the limits, though, so it's a trade-off as always.
Thanks for weighing in, you educated me on this years ago. I'm thinking current drive for just the mid driver might be the simplest way to benefit from current drive without too much expansive problem solving.
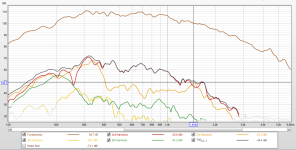
Here is the TC9FD18-08 in a FAST speaker box. H2 doesn't change much, I wonder if Le(i) is the dominant distortion here. I don't think it's my mic because it doesn't follow the SPL. The H2-H3 crossover at 1.2k is an interesting phenomenon.


Here is the TC9FD18-08 in a FAST speaker box. H2 doesn't change much, I wonder if Le(i) is the dominant distortion here. I don't think it's my mic because it doesn't follow the SPL. The H2-H3 crossover at 1.2k is an interesting phenomenon.
Attachments
Bruno used a gradually changing current drive to voltage drive with frequency (or the other way around, don't remember) on the midragne IIRC in de Kii 3.
Jan
Jan
Hello Keantoken,
Could you post the impedance curves of both drivers, preferably in the form of an overlay?
Could you post the impedance curves of both drivers, preferably in the form of an overlay?
There is no reasonable way for me to measure the impedance curves of all these drivers in box right now. I wish there was.
EDIT: The current response curve could be used to extrapolate the driver impedance knowing the series resistance is 20 ohms, but I don't know if there is a way to do this in REW.
EDIT: The current response curve could be used to extrapolate the driver impedance knowing the series resistance is 20 ohms, but I don't know if there is a way to do this in REW.
Hi,Bruno used a gradually changing current drive to voltage drive with frequency (or the other way around, don't remember) on the midragne IIRC in de Kii 3.
Jan
I do not know what tactic they used, but voltagedrive for lows and some "current drive" for mids can be achieved in active speaker using inductor in series with the driver as one pole of low pass filter and take advantage of distortion reduction on the midband, while preserving electrical damping at main resonance. DSP can adjust to what ever frequency response target. I'm not sure if there is any benefit the otherway around, to have voltage drive on mid and current drive on lows.
Here some data I've posted to another thread. Difference between the two is that the other is DSP only, while the other has inductor in series with the driver and of course different DSP preset. It is midrange driver alone, for 3way speaker application. I could use either one, and it is no brainer to use the one with less distortion as the coil costs perhaps 10e. I cannot hear any difference though, at least it is not obvious difference. Distortion is likely low enough not to be audible in the first place. Fb is around 80Hz or so, some distortion increase there border of the visible bandwidth. 1.5mH aircore inductor if I remember, perhaps 1-2ohm resistance to it.


Last edited:
- Home
- Loudspeakers
- Multi-Way
- LRDDMC Loudspeaker Resistor Drive Distortion Measurement Challenge