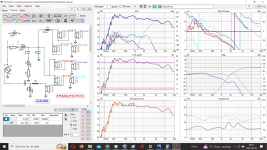
There is a diagram in the VituixCad help files, or one of the linked user guides for VituixCad for REW, and Clio etc.
I think the image here is taken from the user guide.
Many speakers are designed with the idea that the tweeter defines the listening axis 0,0,0.
However, you can choose where your reference data point is. Typically people choose the tweeter axis. Then take measurement on axis for each driver and use that impulse data with the relevant x,y and z data input into VCad driver 2, then driver 3 etc, and updating the x,y, and z with the differing relative positions for each driver to the ref axis.
It is possible to do a two way design by simply leaving the tweeter at 0,0,0 x, y, and z. and not moving the measurement microphone form that axis, then capture the mid woofer response. This simple method should capture frequency and minimum phase data being correct for a xover designed for listening on the tweeter axis. It works but maybe not as good as taking individual measurement for each driver on each driver axis which gives you the ability to tweak X,Y and Z in the simulation and improve things for a final Mark 2. design.
I think the image here is taken from the user guide.
then many designers has specify value of Z such as this -45 mm. Why they add -45mm to program? I usually add + to Z if 6.5" I add around +28 to +30 mm.
Many designers also input Z value but negative. I am confused is Z in vituixcad should be + or -?
for 2 way I use tweeter position as origin of X Y Z axis adjust. Then If tweeter is top of woofer I add Y equal to "-" of distance of center of tweeter to center of woofer such as -180mm For Z, with no Waveguide in tweeter, I also add "+" to Z value of woofer.
Many speakers are designed with the idea that the tweeter defines the listening axis 0,0,0.
However, you can choose where your reference data point is. Typically people choose the tweeter axis. Then take measurement on axis for each driver and use that impulse data with the relevant x,y and z data input into VCad driver 2, then driver 3 etc, and updating the x,y, and z with the differing relative positions for each driver to the ref axis.
It is possible to do a two way design by simply leaving the tweeter at 0,0,0 x, y, and z. and not moving the measurement microphone form that axis, then capture the mid woofer response. This simple method should capture frequency and minimum phase data being correct for a xover designed for listening on the tweeter axis. It works but maybe not as good as taking individual measurement for each driver on each driver axis which gives you the ability to tweak X,Y and Z in the simulation and improve things for a final Mark 2. design.

You simulation merges all drivers into one - which is impossible in reality - so, yes WAY off 😉
The manual describes this of course.
//
The manual describes this of course.
//
x,y,z is not an axis - its a point in space. Most probable the acoustic centre.at 0,0,0 x, y, and z. and not moving the measurement microphone form that axis
//
OK, explain to us how that affects an on axis sim.You simulation merges all drivers into one - which is impossible in reality - so, yes WAY off 😉
The manual describes this of course.
//
OK, describe to me how that affects an on axis simulation.You simulation merges all drivers into one - which is impossible in reality - so, yes WAY off 😉
The manual describes this of course.
//
x,y,z is a driver center position, not an axis.
But, it will be like a giant coax. And as such it will have a very different way of merging the contribution from each driver - be it on axis or not.
//
But, it will be like a giant coax. And as such it will have a very different way of merging the contribution from each driver - be it on axis or not.
//
Post 103. I agree with TNT's correction it is not an axis. I should have been more careful with the description wording.
How do you reckon two 5" drivers 1 meter apart at 300Hz sum at different locations in space? The sim was if both drivers where in same location....Not if they are the same distance from the mic, and identical drivers.
How much error do you think there would be at 300hz from a 2" error and equal spl?
How much from a 3" error at 800hz where one driver is 10dB lower in level? How many dB?
Why not sim reality instead of fiction?
//
Your welcome 🙂Thanks for running my last sim. I thought I had the response with less tilt, but it's about the same.
Sure its possible to tweak that xover.
Okey, understand 👍The x value would be zero for all
Get that to 👍The z offset would be like for a very deep wave-guide
Yes that radius is trickey haha.I don't know the curve radius of your speaker, but I assume that when you measure, the woofers are all close to the same distance from the mic. Small differences make little, to no difference at low frequencies.
First 4 drivers from bottom is flat ( 2 bottom woofers and 2 bottom mids )
Then 3 driver ca 2,5 to grades tillted forward ( mid+twe+mid as a MTM)
Then top 2 drivers ca 5 to grades tillted forwards. ( top 2 woofers )
Tomorrow i plan to test 2 xovers 👍Do you plan to try your last couple of x-overs?
When I make a x-over, it's external, and connected with jumpers. I experiment a lot, and listen for several hours before changes. Sometimes for several weeks, or months. Eventually I pick one.
And yes, i have xover external but 10 to short cables between, and had to screw the xover at the back so superhard to change tings in place.....But i fix it somehow tomorrow.
temp25 !
Here is all needed frd and zma files AND the project in Vituaxcad2.
So now download Vituaxcad2 and start meditate on it 😉
Download
https://kimmosaunisto.net/Software/VituixCAD/VituixCAD2_setup.exe
A most potent diy Linesource speaker for only about $ 260 usd
Regards John
Attachments
Do you even know my speakers radius, when you are saying that?How do you reckon two 5" drivers 1 meter apart at 300Hz sum at different locations in space? The sim was if both drivers where in same location....
Why not sim reality instead of fiction?
Better if you try to come up with suggestions or idea´s, instead of type "se me as an unskilled "idiot"
This is meant to be a fun hobby!
Something seems mixed up here. If you connect them as you write (in series), the impedance doubles and is not halved to 8 Ohms.The drivers are then paralellconnected in pairs to 16 ohm, and then in serie outside at the xover so 8 ohms load.
Series = more Ohms, Parallel = less Ohms.
I don't get what kind of radiation patern you want to get.
You are right it was my error when i wrote it.Something seems mixed up here. If you connect them as you write (in series), the impedance doubles and is not halved to 8 Ohms.
Series = more Ohms, Parallel = less Ohms.
I don't get what kind of radiation patern you want to get.
So series in par to 16 ohm, and paralell outside to 8 ohm at the xover 👍
I was not addressing you as you could see in my quote. OK, I would advise to read up on how the positions x,y,z is used and defined in the program and also set the mic position that is equal to that what you have in your listening position and check out what you get. This would help you to reach the FR that you would like ot listen to. It will also give you an other result than if you have all xyz to 0. When you listen to a speaker in a room, 10% is coming from on axis and the rest is from reflections, thus, a speakers behaviour in all directions is important. xyz pos has a great impact on this behaviour.
//
//
Your spot on Dan 🙂Don't take this the wrong way but the theory puzzles me. Part of this speaker will be a line source and the other part will be a point source. And like any two way speaker both will be producing sound at the crossover frequency.
That is my goal.
A 2,5 way linesource with pointsource behavior.
So far it working real good
Hi Ray 🙂There is a diagram in the VituixCad help files, or one of the linked user guides for VituixCad for REW, and Clio etc.
I think the image here is taken from the user guide.
I dident see these 5-6 post by you or others until now = late.
Will check your linked tread, thanks!
I will not take individual measurement for each driver on each driver axis in this case, i have measured in pairs and thats give me enough information to build a really great speaker 🙂Many speakers are designed with the idea that the tweeter defines the listening axis 0,0,0.
However, you can choose where your reference data point is. Typically people choose the tweeter axis. Then take measurement on axis for each driver and use that impulse data with the relevant x,y and z data input into VCad driver 2, then driver 3 etc, and updating the x,y, and z with the differing relative positions for each driver to the ref axis.
It is possible to do a two way design by simply leaving the tweeter at 0,0,0 x, y, and z. and not moving the measurement microphone form that axis, then capture the mid woofer response. This simple method should capture frequency and minimum phase data being correct for a xover designed for listening on the tweeter axis. It works but maybe not as good as taking individual measurement for each driver on each driver axis which gives you the ability to tweak X,Y and Z in the simulation and improve things for a final Mark 2. design.
I have no use to tweak X,Y and Z for all drivers in my Linesource simulation, think its more for 2-300.000 $ speakermanufactor to have some PR
My curving/radius is there just for the reason, that all drivers sound will meet my ear in the sofa about the same time.
Then whether I succeed in it, is another matter hahaha
The xyz functions are easy to use but the situation is complicated since the reasons for invoking each axis are different, and the positional controls have limited scope which affects when you should use them.
You must not enter x, y and z for each driver without a specific reason and I'll outline these for a typical case (your own way is OK if you understand the consequences).
Measurements are usually timed to include delay. Changing the z parameter individually would double up on the delay differences. Measurement is the best way to capture those and it is unnecessary, complicated and potentially misleading to extract a delay figure to include in the simulation. It is also unnecessary to do if you want to successfully arrive at a delay figure to apply to a DSP. The most common use for the z parameter will be for people with USB mics.
The x and y parameters are the primary way that Vituixcad calculates the spatial effects of the combined aspect of the polars. For the simplest case this means the crossover region itself, since you don't measure the drivers together (you want it to change as you change the filters). It is also suitable for line array use (etc..) affecting power and lobing beyond the individual polars.
This intended use is the reason that the manual states that individual drivers should be measured around their own axial planes, since again we don't want to double up on (some of the) effects.
For those thinking outside the box.
There are certain things that these parameters do and things which they don't do and this affects what they can be used for. They change the relative delay (phase), they change intensity with distance and they change the spatial summing in a couple of different ways.
They do not change the baffle effects such as the baffle step and response variations, and they do not change the path length around the cabinet on different sides. Eg therefore you could hide them behind a virtual baffle and still see output.
There are two things that come from this.
1. With unique speakers you have to measure according to your specific simulation needs,
2. You have to re-measure if certain types of change are made or certain simulation intentions are altered.
- Home
- Loudspeakers
- Multi-Way
- Linesource measurements and xoverbuilding