Thanks. Looks like a 25dB difference - far better than I would have guessed by eyeballing the IR. Shading will improve this without question. I'm not very concerned about combing (different conversation.)
The FR is showing magnitude but not phase. The phase response is probably very hashy at higher frequencies, so smooth, flat magnitude response alone doesn't necessarily mean the IFT yields a "clean" IR as a general principle (although your particular measurement is certainly encouraging.) IOW, the IFT isn't unique for an LTI system that isn't minimum-phase. Large arrays at higher frequencies rarely qualify as minimum-phase at the listening position even in a reflection-free environment.
Or at least that's my recollection after 30 years of not diving into the background theory (!) So no, I'm not convinced that a large array, unshaded or Legendre-polynomial shaded, will yield a good IR even with an outstanding magnitude frequency response. I'll take that to an extreme: let's assume the large array is EQd to perfect flatness at a given observation point over an infinite range of frequency. The IR isn't necessarily a Dirac delta function because of the failure of causality.
Last edited:
Can you point me to the 25 dB difference you talk about? Because all I see is explained by the splash of energy that the array is shooting at floor and ceiling, disrupting the frequency curve between that 0,5 and 6 ms period (like expected). The first 0.5 ms of the IR being the arrival of the separate drivers in the array, and after that the floor/ceiling reflections that follow. I don't expect the top end to produce a flawless minimum phase result, but I'm not sure what you're getting at.
.png")
Here's the simulated impulse of an unshaded array, without floor and ceiling reflections:

Versus it's shaded counterpart:

(Still a group of 5 unshaded drivers making up the top end)
Versus it's shaded counterpart:
(Still a group of 5 unshaded drivers making up the top end)
Hi Wesayso - no surprises whatsoever in all that (later) data, thank you for sharing it. About -25dB - I probably misintrepreted the graphs you showed in post #60. Upon re-examination, I see a 0-0.5ms window interval in the first graph, and a 0-6.0ms window interval in the second graph. I was hoping for a 0.5ms (ish) - 6.0ms window in the second graph; sorry if my first request wasn't clear. Or, just show a CSD from 0-6ms if that's easier. (As is often the case, same information, different view.) With this interpretation, that later spectrum should show much more magnitude/phase hash and a level not terribly far below the level of the spectrum associated with the bulk of that initial IR decay. We expect some of the earlier decay in that later window to reflect the later arrival of the radiation from the drivers farthest from the measurement point relative to that from the closest drivers, and the later decay to come mostly from room reflections, possibly dominated by the floor contribution.
It all comes down to the following, and again, my stale 30yr-old knowledge of some of this theory may be interfering with my understanding, so I appreciate your patience and understanding:
From linear superpositioning, or something very, very close to linear superpositioning, the varying distances from the drivers in the line array to the measurement point has to "smear" the collective IR. With a curved CBT and shading, the smearing there should, I would think, be even worse since the transit time variation, given its curvature, is even greater than that for a straight array. The general implication of that smearing should approximate a low-pass filter at the measurement point with possibly something not far from -3dB/oct attenuation in the case of the unshaded straight line array.
So, the first line of attack in LTI land is to EQ to restore to flatness. But after that, what does our IR look like, apart from room reflections, as far as that can be determined? That's where my question about a minimal-phase condition and the resulting IFT implication for the IR comes from. My suspicion is that since at the HF extreme the phase response spreads far beyond a 2pi range at the measurement point, flatness may no longer ensure that the IFT is indeed a Dirac delta function, but something that still looks like hashy smearing.
Do hope that explains it; thanks again for bearing with me.
Dare I put my 50 year stale understanding of superposition up against yours? If you do that superposition in the frequency domain, you get a single sinusoid at some resultant phase of the test frequency. Its a basic identity. I don't see where that implies smearing. It might in fact prove that it doesn't.. Only if all those different phase signals from each element of the array didn't combine into a single sinusoid of the same frequency would there be smearing.
Hi nc535 - I think my quandary will be clearest if you think of this in the time domain, with each driver in the array radiating, let's say, a delta function at a given moment in time. The sum of those delta functions arrives at the measurement microphone. Since the individual transit times differ because the transit distances differ, the sum can no longer be a simple delta function. If you convolve that mess with an infinite sinusoid wavetrain input, I believe the acoustic result is still the same sinusoid of the same frequency.
Last edited:
Here it is, I hope...
I figured I could just filter the IR from the simulation, as that wouldn't show any room related stuff. Now that I get what @mapirc is getting at...
I made a sequence of graphs, starting at 0,0 to 6,0 ms window, stepping in up in 0,5 ms steps:

This is the simulated straight array, consisting of 25x TC9 FD18-08
Looking at the waterfall graph of a 6,0 ms window with a rise time of 0,1ms:

Simulated straight array, waterfall plot covering 6 ms
For my frequency shaded array, I see no point in doing the animation, see the 0,5 to 6,0 ms gated window:

Simulated straight frequency shaded array, gate 0,5 to 6 ms, 25x 10F 8414G10 (not that it matters in this simulation 😉)
And the waterfall plot that belongs to it:

Simulated straight frequency shaded array, waterfall plot covering 6 ms
The shading does what it's supposed to do, clean up the top end. It's why I wanted to try and incorporate it. Well, this clean up and the fact that the shading reduces the level of energy it splashes to floor and ceiling.
.png")
I figured I could just filter the IR from the simulation, as that wouldn't show any room related stuff. Now that I get what @mapirc is getting at...
I made a sequence of graphs, starting at 0,0 to 6,0 ms window, stepping in up in 0,5 ms steps:
This is the simulated straight array, consisting of 25x TC9 FD18-08
Looking at the waterfall graph of a 6,0 ms window with a rise time of 0,1ms:
Simulated straight array, waterfall plot covering 6 ms
For my frequency shaded array, I see no point in doing the animation, see the 0,5 to 6,0 ms gated window:
Simulated straight frequency shaded array, gate 0,5 to 6 ms, 25x 10F 8414G10 (not that it matters in this simulation 😉)
And the waterfall plot that belongs to it:
Simulated straight frequency shaded array, waterfall plot covering 6 ms
The shading does what it's supposed to do, clean up the top end. It's why I wanted to try and incorporate it. Well, this clean up and the fact that the shading reduces the level of energy it splashes to floor and ceiling.
looking close to kuze array step response (32 x 2" tang bands)
https://projectgallery.parts-express.com/speaker-projects/kuze3201-line-array/
step response, sorry for the blur but trying to make it big enough to see
https://projectgallery.parts-express.com/speaker-projects/kuze3201-line-array/
step response, sorry for the blur but trying to make it big enough to see
Attachments
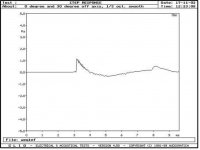
Wesayso - Nice! Looks quite reasonable. Thanks for going through all that time and trouble to get those great visuals. It certainly seems to show the benefit of shading (but a shorter unshaded line array accomplishes somewhat the same thing?)
Well, an ideal STEP would look like a triangle, for a source that doesn't play from zero to infinity...
Like this STEP that I just created, with a second order crossover at 80 and 18000 Hz:

(the black line being the STEP response obviously)
The above should represent the ideal shape at this limited bandwidth. I've often seen that graph from kuze being shown, where people mistake that triangle to represent the separate drivers arriving. That isn't true. He is showing the STEP of a band limited output, his array. If it had more bottom end, it would fly for more seconds above the zero line.
Let's see, I probably have one, be it with a "shaped" frequency curve, so it will shape the STEP as well...

Showing the IR and step of the (then) unshaded array. Obviously the bandpass I used did not stop at 80 Hz, as it crosses zero after about 7 ms.
The shape of it is determined by my preferred in-room frequency curve.
An ideal Dirac pulse would look like this:

From zero to infinity, the STEP keeps that straight line.
A STEP and IR measurement of a DAC:

Obviously it isn't extending all the way to zero Hz 😀.
Like this STEP that I just created, with a second order crossover at 80 and 18000 Hz:
(the black line being the STEP response obviously)
The above should represent the ideal shape at this limited bandwidth. I've often seen that graph from kuze being shown, where people mistake that triangle to represent the separate drivers arriving. That isn't true. He is showing the STEP of a band limited output, his array. If it had more bottom end, it would fly for more seconds above the zero line.
Let's see, I probably have one, be it with a "shaped" frequency curve, so it will shape the STEP as well...
Showing the IR and step of the (then) unshaded array. Obviously the bandpass I used did not stop at 80 Hz, as it crosses zero after about 7 ms.
The shape of it is determined by my preferred in-room frequency curve.
An ideal Dirac pulse would look like this:
From zero to infinity, the STEP keeps that straight line.
A STEP and IR measurement of a DAC:
Obviously it isn't extending all the way to zero Hz 😀.
Last edited:
Wesayso - Nice! Thanks for going through all that time and trouble to get those great visuals. It certainly seems to show the benefit of shading (but a shorter unshaded line array accomplishes somewhat the same thing?)
Yes it would, at enough distance. In my shaded array, I still have 5 drivers playing full range. The reason for me to want the tall array is to have enough SD area to also play low (with some authority) and avoid most floor and ceiling reflections. That's why I use frequency shading, meaning the bottom end is all 25 drivers playing.
These days the low end is done with subwoofers, but I ran the unshaded arrays full range for a long long while.

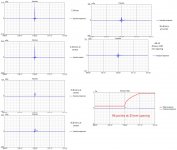
I was pretty sure the IRs wouldn't be smeared because I recall the derivation of the response of an infinite line array has an unsmeared impulse and I've done measurements of real arrays. When I dug out an old line array simulation of 24 drivers at 100 mm spacing and progressively unmuted drivers from the center outward, the smearing was obvious. Impulse height is reduced but it gets wider. even saw twin peaks. I don't understand that but I thought I should report it, given my earlier comment. These were point source drivers with no EQ spaced 100mm.
I looked at other sims, with eq, shaded and eqed, finer spacings, and saw a single impulse, albeit shorter and wider than a single driver. the example in the lower right of the attached isn't EQed or shaded but has very small point spacing.
All these simulations are of a finite array in free space so they don't approximate that infinite line source very well. A real floor to ceiling line array, extended by floor and ceiling reflections, and with directive drivers, doesn't either but it comes closer than these point source simulations.
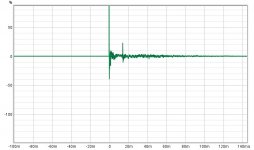
The 2nd attachment is the IR of an array of 32 2.5" drivers that I actually built in a treated garage with 8' ceiling. It is unsmeared and shows the one prominent reflection I couldn't get rid of no matter how much fiberglass I put against the walls
I looked at other sims, with eq, shaded and eqed, finer spacings, and saw a single impulse, albeit shorter and wider than a single driver. the example in the lower right of the attached isn't EQed or shaded but has very small point spacing.
All these simulations are of a finite array in free space so they don't approximate that infinite line source very well. A real floor to ceiling line array, extended by floor and ceiling reflections, and with directive drivers, doesn't either but it comes closer than these point source simulations.
The 2nd attachment is the IR of an array of 32 2.5" drivers that I actually built in a treated garage with 8' ceiling. It is unsmeared and shows the one prominent reflection I couldn't get rid of no matter how much fiberglass I put against the walls
Attachments
It left me wondering a bit too... for all I have done with these arrays, I always felt that they were acting as a minimum phase devise. So I investigated some more.
So I took the waterfall of the simulated unshaded straight array:

And started looking how it reacted to a bit of (quick) corrective EQ:

I didn't feel the need to do this to perfection, as it is a pointless exercise. One would never want to EQ-away combing, as I'm pretty convinced that's what I'm doing here. I could EQ it to perfection at a single point in space. Heck, I've tried that (as an exercise) in the past using an IR of a Stereo pair. But you wouldn't want to listen to it like that, as it would be bad when listening a few cm to the side of that EQ-ed (to perfection) point. But still, it is acting as a minimum phase device. This EQ work also cleans up the IR if done with care. (which I didn't do here, just quick and dirty)
I could have done an IR inversion, but manually EQ-ing in REW gave me time to think it over 😉. Be warned: This isn't something you want to do! It will create horrible sounding results, with great looking IR and FR graphs. Only in one spot though, not what you'd want.
So in hindsight, I think it is the combing that is to blame here, for not following the "no smearing" behavior. And combing is related to the distance to the array + the center to center spacing of the drivers used, thus it makes sense that an array with smaller sources (like nc535's 2.5" drivers) suffers less from this phenomenon. Even more so if his listening/measuring distance was more than 3 meter. Heck, it's easy to EQ it away in that case, just not always wise to do so. That's why I have often used measurements made at several point close by the ideal sweet spot and averaged them, even though a single spot correction often did sound best.
I've always gone over the generated DSP correction and dialed down any "over-correction" by hand though. Easy to do so by measuring at a few different spots and comparing results. The shaded array hardly has any combing left, that shows here in this comparison. The line length gets longer, the lower one goes in frequency.
All EQ here, even the EQ to correct the frequency curve within Vituixcad, has been minimum phase EQ, no linear or mixed phase was used in these samples/simulations from me.
(With the exception that the measured EQ's posted to this thread, from longer ago do show mixed phase results, for entirely different reasons)
So I took the waterfall of the simulated unshaded straight array:
And started looking how it reacted to a bit of (quick) corrective EQ:
I didn't feel the need to do this to perfection, as it is a pointless exercise. One would never want to EQ-away combing, as I'm pretty convinced that's what I'm doing here. I could EQ it to perfection at a single point in space. Heck, I've tried that (as an exercise) in the past using an IR of a Stereo pair. But you wouldn't want to listen to it like that, as it would be bad when listening a few cm to the side of that EQ-ed (to perfection) point. But still, it is acting as a minimum phase device. This EQ work also cleans up the IR if done with care. (which I didn't do here, just quick and dirty)
I could have done an IR inversion, but manually EQ-ing in REW gave me time to think it over 😉. Be warned: This isn't something you want to do! It will create horrible sounding results, with great looking IR and FR graphs. Only in one spot though, not what you'd want.
So in hindsight, I think it is the combing that is to blame here, for not following the "no smearing" behavior. And combing is related to the distance to the array + the center to center spacing of the drivers used, thus it makes sense that an array with smaller sources (like nc535's 2.5" drivers) suffers less from this phenomenon. Even more so if his listening/measuring distance was more than 3 meter. Heck, it's easy to EQ it away in that case, just not always wise to do so. That's why I have often used measurements made at several point close by the ideal sweet spot and averaged them, even though a single spot correction often did sound best.
I've always gone over the generated DSP correction and dialed down any "over-correction" by hand though. Easy to do so by measuring at a few different spots and comparing results. The shaded array hardly has any combing left, that shows here in this comparison. The line length gets longer, the lower one goes in frequency.
All EQ here, even the EQ to correct the frequency curve within Vituixcad, has been minimum phase EQ, no linear or mixed phase was used in these samples/simulations from me.
(With the exception that the measured EQ's posted to this thread, from longer ago do show mixed phase results, for entirely different reasons)
Last edited:
- Home
- Loudspeakers
- Multi-Way
- Line Arrays, directivity and impulse response