Yeah, do that. Only beware that with the "real" impulse it's likely you won't get the same quality of the result, so it can be very easily "different"... But not better / closer to reality.
Last edited:
I think he means "simultaneous calculation" of impulse ....
Its indisputable - no impulse has been offered to the DUT input terminals.
Its just not super stringently expressed I guess...
This seems like semantics to me. Yes the impulse response is derived rather than directly measured for very good reason. The DUT has still been measured so it is hardly a complete misuse of the term.
"The deconvolution of the system’s impulse response can then be obtained simply by convolving the measured output signal y(t) with the inverse filter f(t)"
This is why he uses the term Simultaneous
"It was discovered that employing a sine signal with exponentially varied frequency, it is possible to deconvolve simultaneously the linear impulse response of the system, and separate impulse responses for each harmonic distortion order."
As a deconvolved sweep is generally more accurate you may well find that you have to make the real thing live up to the impersonation 😉I know, its hard with real impulses - very little energy, background noise etc etc but just because its hard it should not be avoided or impersonated for a sweep ... 🙂
If you are able to make a clear overview of all subsystems, eg of a woofer, which is universally valid (ie indisputable), then you can get started at Klippel without applying for a job, because they can't 😉
To my knowledge, no one has succeeded so far.
Wrt some subsystems there are at least 5 or 6 (slightly) different schools of thought/approaches.
We must be talking about something else because these things I am talking about have been at least known for a decade or two. With a few corrections and clarifications the last couple of years.
Cool.
I'm not so impressed with the "Simultaneous"-ness as I don't really see any use of it. I can wait 1 second for the Impulse graph ;-)
//
I'm not so impressed with the "Simultaneous"-ness as I don't really see any use of it. I can wait 1 second for the Impulse graph ;-)
//
This seems like semantics to me. Yes the impulse response is derived rather than directly measured for very good reason. The DUT has still been measured so it is hardly a complete misuse of the term.
"The deconvolution of the system’s impulse response can then be obtained simply by convolving the measured output signal y(t) with the inverse filter f(t)"
This is why he uses the term Simultaneous
"It was discovered that employing a sine signal with exponentially varied frequency, it is possible to deconvolve simultaneously the linear impulse response of the system, and separate impulse responses for each harmonic distortion order."
As a deconvolved sweep is generally more accurate you may well find that you have to make the real thing live up to the impersonation 😉
It seems even 2x above "F" is just "barely making it" with a 4th order LR ....I'd have to sit down with measured response and VirtuixCad to make it all make sense.
When you guys are doing this, do you use measurements at 1m....direct energy measurements (aka as close as possible/horns mouth) or at the listening position?
Cutoff can be as technical as defined or as loose as the Designer dares, apparently. Not to jump on back on that topic but. My horn builder seems to be calling the fundamental mode the F of his horns...thank God too...They seem to be experimenting but I told them I wanted the same "formula" for these 150hz horns....ie...I want to see the root mode at...150hz.
GM made the statement that a large horn is better used with a HP much higher than cutoff....if aiming to use a 1st order XO, I see why, now.
Last edited:
Lol, I got them from another forum, but I'm sure you recognize your stuff lol
I saw the measurement you shared in your thread here and it looks pretty much the same....identical even lol
It would be great if you would just share your group delay measurements...and burst decay...and electrical impedance if you have that....heck just share rew file while your at it!
I don't often take measurements with REW...it's usually either for THD or specifically needing to share more familiar REW screens on these forums.
I typically use Smaart, mainly for it's real-time transfer function capability, and how that lets me take less annoying measuremnts with pink noise or music.
It doesn't have the bells and whistles of REW, but i continue to believe transfer mag and phase traces show us at least 95% of the info we need for speaker building....and getting all the pretty ancillary graphs to look great.🙂
It really is like all the guys are telling you...transfer function equals impulse, and can be converted one to the other....ALL the other analytics are just different looks.
My group delay measurements are all the same...on every build, for every driver section. *Zero. No graph needed 😉
*other than the very bottom end of freq response <30Hz, where freq rolloff begins
Last edited:
If you null a GD to what you might call 0... that pushes the start of the signal to a negative m/s value. GD is when peak energy is reached, not when the signal actually starts moving...that would be phase, I think but maybe not. Can the start of signal equate to being somewhere else in cycle aside from 0 amplitude?
Almost got some good Horn info on the B&C ME464 horn....Almost, Mark is holding out on us.
Actually you know what....that makes no sense what I said above because the whole spectrum starts well before peak energy if I am reading the CSD correct...Everything that is on the Negative side

Too bad burst decay cannot be displayed with the negative portion and time to peak energy.
Ok you can fix GD but....you are still holding out on those measurements lol!
Almost got some good Horn info on the B&C ME464 horn....Almost, Mark is holding out on us.
Actually you know what....that makes no sense what I said above because the whole spectrum starts well before peak energy if I am reading the CSD correct...Everything that is on the Negative side
Too bad burst decay cannot be displayed with the negative portion and time to peak energy.
Ok you can fix GD but....you are still holding out on those measurements lol!
Attachments

Last edited:
It really is like all the guys are telling you...transfer function equals impulse, and can be converted one to the other....ALL the other analytics are just different looks.
There is one important thing being missed then....Phase being pushed forward in time...in real life....doesn't jump from one side of the chart to the other.....there is no time travel.
Yes it will eventually line up again but now there is a delay....keep pushing phase further out in time....it will be out of phase until, it is in phase, yet again....but now the time delay is increased even more so.
Last edited:
Mostly it is not a measurement of an impulse response. Most systems (e.g. REW etc) perform a slow (1-10 sec) FR sweep and out from that, calculate impulse response and phase response.
Very few, if any, have a (1) discrete impulse as the measurement stimuli. I would like to see a true impulse stimuli based system as I think the jolt of an impulse is a quite different task than a slowly gliding frequency change in what is almost steady state.
Both ARTA and Smaart allow a discrete impulse stimulus to directly measure an impulse response.
No doubt others do too. (Can a REW captured scope trace be exported/converted to an impulse file?)
Recording a balloon pop for example of a physical stimulus.
(This still remains a good technique to excite a room evenly, omnidirectionally, when a omni speaker like a dodecahedron isn't available.)
Using a dirac pulse to excite the speaker for an example of an electrical signal.
(Works well, but periodic noise matched to FFT size most often works better.)
doesn't jump from one side of the chart to the other.....there is no time travel.
What do you mean by that... is this about phase folding at 180 degree in graphs? Can you show a graph, or better yet a measurement showing this?
I'm simply not the only one being fed up with your spreading of nonsense. It's a purely factual matter.
Members only need to read these posts to get a sense of your character, associated misguided superiority and disrespectful attitude.
Over 100 years of history in acoustic horns can be taken off the table, because we now have your/Geddes superior waveguides.
Explain to me why no professional manufacturer uses these horns? Those who did (JBL and EAW) gave up 15 years ago.
Why did one of the few owners of Gedlee Summas in Europe considered it completely inferior in every way, after listening to Tony Gee's Calpamos?
Last edited:
Almost got some good Horn info on the B&C ME464 horn....Almost, Mark is holding out on us.
Ok you can fix GD but....you are still holding out on those measurements lol!
I'm not holding out on you, you just won't accept i gave you what i have.
(and that i don't feel the need for more)
Here's is the on-axis tuning trace (10 deg H) that was in the set of dcx/me464 measurements of mine you posted in #7974. (from Smaart)
I toggled the phase graph to change it to group delay for you.

As you can see ....it's flat 0.
You can also see both mag and group delay traces disappear below about 275Hz. Reason is it was windy and i use Coherence blanking to drop data where data is no longer good...(the bright red trace at the top of the magnitude pane is coherence.)
Without wind, both mag and group delay would extend lower cleanly.
But even with the difficult meas conditions, you can see how clean things are to at least a -12dB summing region......
....which illustrates why i use steep linear-phase xovers....
It avoids all the unnecessary group delay issues and crappola everyone spends so much time on.
I get flat mag, flat phase, great impulse, and most importantly.... beautiful sound....easily.
Only mention i'll make about phase audibility, is everyone has heard my opinion about it too much already, so i'll simply say spot-on timing (which is what phase is all about) is working very well for me. To each his own, enjoy 🙂
Yes I was talking about folding....I'd have to create a visual, but I think you already understand folding.

Prepare to be confused =)
It took me a while, to realize what the negative side of the graph is...though it should be obvious, that is unless I am wrong. In the case that I am right...We are witnessing the creation of pressure...time to peak energy is no less...time to peak pressure... Why is so much pressure being generated so much earlier in the bass region vs treble.
The blue trend line is the first recognition of pressure in my mind at this time. Correct me if I am wrong. And where in the heck is the real 0 in time!
Burst decay gives a n interesting view since the time scale is relative to Frequency period. It appears here that The time to peak energy is now the base line 0 for Burst Decay...potentially this makes Burst decay slightly misleading btw, since we have no idea when the signal started, truly....
please correct me if I'm wrong
Attachments
Last edited:
OK 🙂 Thanks for the guidance, they might have missed that.Members only need to read these posts to get a sense of your character, associated misguided superiority and disrespectful attitude.
So what? I don't have a clue what you are trying to say. For example, I don't have a Ferrari.
- Edit: OK, you deleted the post. That's better indeed.
- Edit: OK, you deleted the post. That's better indeed.
OK 🙂 Thanks for the guidance, they might have missed that.
pp.
Yeah but do either of you understand the negative time area of the CSD in wavelet mode
Why would anyone want to try to understand what you believe are your 'never before realized advanced discoveries', when it's so readily apparent to all that you don't have much of a grasp on the basic fundamentals of measurements?
Not trying to be harsh...just saying please get real, so when you do have a bright idea, you present it with an air of humility that comes with a search for understanding, rather than from an air of look at how smart i am.
I presented some theories and asked to be corrected if wrong........................................................................................................................................
You literally just quoted one of my main questions.....and told me no one wants to understand lol!!!
I don't have any discoveries, I have theories and questions lol
You literally just quoted one of my main questions.....and told me no one wants to understand lol!!!
I don't have any discoveries, I have theories and questions lol
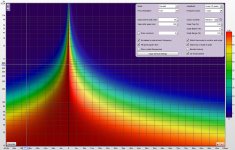
camplo,
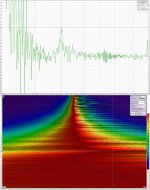
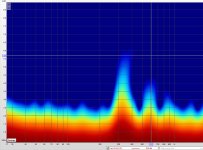
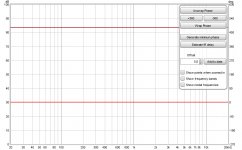
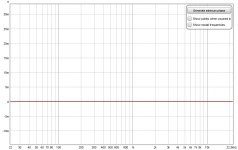
Here's a perfect Dirac pulse, can't get any better than that:

Impulse and STEP

Frequency and phase

Group delay

Wavelet
Does that answer your concerns about negative time area in CSD mode? The above graphs are from basically an ideal source. So every note is instant, no group delay and from zero to infinity Hz. (well almost)
I created that Dirac pulse with RePhase, and so could you. That could serve as study material and an the example of the illusive ideal.
Here's a perfect Dirac pulse, can't get any better than that:
Impulse and STEP
Frequency and phase
Group delay
Wavelet
Does that answer your concerns about negative time area in CSD mode? The above graphs are from basically an ideal source. So every note is instant, no group delay and from zero to infinity Hz. (well almost)
I created that Dirac pulse with RePhase, and so could you. That could serve as study material and an the example of the illusive ideal.
Attachments

Last edited:
- Home
- Loudspeakers
- Multi-Way
- Is it possible to cover the whole spectrum, high SPL, low distortion with a 2-way?