Yes - hyou seem to have e.g. bass driver be positioned 470m (meter!?) away from the tweeter? I think this was mentioned earlier above - but maybe you are in control.
Look at this example from the pdf manual - it uses "mm" - maybe you want to check all your distances once more?
I suppose it should be OK to set the twteer to be "origo" (0,0,0) and a reference for all other positions...

I must add that I have only played with this app very briefly so not experienced with a full design and implementation circel.
//
Look at this example from the pdf manual - it uses "mm" - maybe you want to check all your distances once more?
I suppose it should be OK to set the twteer to be "origo" (0,0,0) and a reference for all other positions...
I must add that I have only played with this app very briefly so not experienced with a full design and implementation circel.
//
Last edited:

I see you point, but in VitauXcad2 it lock like this when you set the Y, X & Z axis, it say "mm"Look at this example from the pdf manual - it uses "mm"
Attachments
Yes, good to know. Beside that, the maximum of 5,000mm keeps the values sensible.
I see that your tweeter band is more filled than the midrange. You have an increase in power without an increase in response. You will have greater room involvement there.
I see that your tweeter band is more filled than the midrange. You have an increase in power without an increase in response. You will have greater room involvement there.
Yes having a woofer 470 meter away, seems like a waste 😉Yes, good to know. Beside that, the maximum of 5,000mm keeps the values sensible.
Is all that colured "lines" everywhere, that i can´t interpret or even know "how it should look", and to strive for!I see that your tweeter band is more filled than the midrange. You have an increase in power without an increase in response. You will have greater room involvement there.
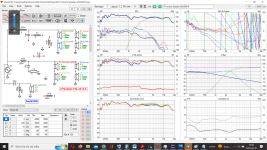
In box CTA-2034 Some red line says "power DI" and in-axis, predicted in-room, Sound power.
What to strive for here?
And box "GD & Phase", It´s lines everwhere, and drivers no 1, 3, 6, 7 ( 2 mids and 2 woofers) phase goes down and up in a curve ?
Is that okey ?
The simulations in VituaXcad2 are measured in pair so driver no 1 and 3 have the same FRD and ZMA files (and also 4 & 5, 6 & 7, 8 & 9 ), then i set -3 dB spl on every driver in Vcad to balance the simulations spl.
best regards John
For example around 1kHz you have green areas above and below (little sound there). It is focussed toward the middle.Is all that colured "lines" everywhere, that i can´t interpret or even know "how it should look", and to strive for!
Red to rise with frequency. It is OK for it to level off. Blue to fall with frequency. Smoothness is good.In box CTA-2034 Some red line says "power DI" and in-axis, predicted in-room, Sound power.
What to strive for here?
Yes. At high frequencies their delay makes them change quickly. The settings can make them go up or down.And box "GD & Phase", It´s lines everwhere, and drivers no 1, 3, 6, 7 ( 2 mids and 2 woofers) phase goes down and up in a curve ?
Is that okey ?
This is not as much of a problem as it seems. You are interested in what is left after the delay, and you can ignore what happens above the cross.
It is OK to take some shortcuts like this. Normally you'd think about a separate set of vertical measurements.. but it will be less significant than the information you already have so it's not certain to tell you a whole lot more than you already know.The simulations in VituaXcad2 are measured in pair so driver no 1 and 3 have the same FRD and ZMA files (and also 4 & 5, 6 & 7, 8 & 9 ), then i set -3 dB spl on every driver in Vcad to balance the simulations spl.
Can you in a picture please show me how a "okey" and a "good one" looks like?For example around 1kHz you have green areas above and below (little sound there). It is focussed toward the middle.
Same here, a picture please Allen.Red to rise with frequency. It is OK for it to level off. Blue to fall with frequency. Smoothness is good
You know they say that "a picture is more than 1000 words" 🙂
best regards John
I went looking through the threads near the top of my 'watched' list and I came across this post - https://www.diyaudio.com/community/...way-based-on-bliesma-m74a.420575/post-7866184Same here,
It is not the only shape to look for, I find others work better for me.
What you'll notice is that the DI doesn't fall back down. It can also be seen that power is a mirror image (only in an ideal drawing like this) since they are related.
My drawing tools are unavailable at the moment, sorry.Can you in a picture please show me how a "okey" and a "good one" looks like?
There is not just one which is good. Your line array is an option, a spherical radiator is another. Neither is "wrong", but different situations have their constraints and there may be more than one way to do it. A line array is going to radiate forward at higher frequencies. It will not spread much up or down since it is acoustically large at these frequencies. This is why it is focussed in the middle.
How would you describe your cross? Is it balanced at frequencies above and below? What is the thing you're most wanting from a cross at this time?
How in h--l do somebody create that curves, or even near at all ?It is not the only shape to look for, I find others work better for me.
What you'll notice is that the DI doesn't fall back down. It can also be seen that power is a mirror image (only in an ideal drawing like this) since they are related.
For me with my 9 driver simutations in Vcad2, im miles from that lines in box CTA-2034!
Going crazy hahaha.
This its how my looks
Attachments
Like " i not hear the crossing" type.How would you describe your cross? Is it balanced at frequencies above and below? What is the thing you're most wanting from a cross at this time?
Balanced hmmm, must listen some more and valuate that 👍
Wanted that the 8 peerlees "help eachother maximal", and also find "best" crossingpoints both for woofer to mid and mid to WG tweeter.
The Audax 025028A "gold" can work quite low IF it is "a better" solution, but in my mind a "ultimate" crossing from mid to twee is 2800-3200 hz.
Maby thats NOT the "best" for this project, i really don´t know!
regards John
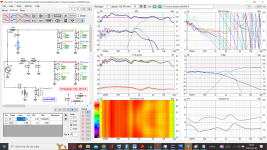
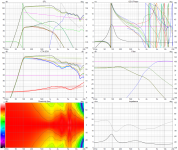
Please take this info as a rough simulation, the only reason I am providing it is to show simulated CTA 2034 and directivity information for Jawen.
I used an SB26 tweeter the waveguided one to give approx 95dB sensitivity. I know Jawen did post some tweeter data but it was not easily traceable and there was also a small amount of tabulated data, consequently I took the easy way out and substituted the SB26WG and used SPL trace for the 0 degree axis from the data sheet. I guess if anyone has the Audax FRD and ZMA it could be updated with the correct tweeter data.
I did this some weeks ago in the early part of Jawens Journey with this project. I do chat to Jawen, so I have not been withholding any information from him.
Attachments

Hi RayI did this some weeks ago in the early part of Jawens Journey with this project.
Now when i have been focusing on CTA-2034 box, i better understand why you post me this earlyer 👍
It so much "trying to understand", and they are so many technikes to use (for the same goal)
Will try to studdy your sim a little and see if " some light" turns on i my head 😉
Best regard John
Simulated from my "in-pair" measurements.Is that how it measures or simulates?
And i try playing around in Vcad2 try to create this lines in CTA-2034 that Allen showed.
So, if I posted a x-over, could you easily, (using this estimated data), plug it in and show the graphs Jawen is interested in?Please take this info as a rough simulation, the only reason I am providing it is to show simulated CTA 2034 and directivity information for Jawen.
I used an SB26 tweeter the waveguided one to give approx 95dB sensitivity. I know Jawen did post some tweeter data but it was not easily traceable and there was also a small amount of tabulated data, consequently I took the easy way out and substituted the SB26WG and used SPL trace for the 0 degree axis from the data sheet. I guess if anyone has the Audax FRD and ZMA it could be updated with the correct tweeter data.
I did this some weeks ago in the early part of Jawens Journey with this project. I do chat to Jawen, so I have not been withholding any information from him.
Let me be sure I understand what's being done here. All these graphs showing the off axis are "speculated / estimated" by the software. No off axis measurements have actually been used.
So the attempt here, is for the software to predict what the off axis would look like if the speaker was built, and measured.
The graphs are supposed to tell you what it should sound like before you build it. That way you can make design changes to improve the odds of making something you will like.
Last edited:
The way you create them is only partly related to the work you do in the simulator. The basis is the physical configuration.How in h--l do somebody create that curves,
Take this example (juhazi's avatar). It is a dipole which radiates mostly at 0 and 180 degrees but little at 90 degrees.
Without polar measurements, VC is going to show the effect of the driver configuration (the line array crossing to a spherical radiator) and the crossover lobing.So the attempt here, is for the software to predict what the off axis would look like if the speaker was built, and measured.
Within the limitations of the single measurement, of course. I expect we can imagine softening the wide dispersion of the tweeter since it has a waveguide. Baffle step may be questionable but directivity of the line array drivers might be consistent with them being crossed within their pistonic region.
- Home
- Loudspeakers
- Multi-Way
- Is any of these 2 xover technically preferable?