Right click the directivity plot and choose polar map. Right click on the impedance plot and choose directivity chart. Right click on the impedance plot and choose polar map.How i make a "polar plots" ?
You have changed 'Y' for the crossover. The polar map will show this difference now, even if you don't measure at many angles.And can i use the measurements from 2 days ago to "make polar" ?
0If my cabinette is 230 mm wide with rounded corners, and the WG is 175 mm wide placed in the middle.
What is the X axis ? (115 mm ?)
You make a good point here.. but looking at your most recent speaker I can presume that you know that the image doesn't give you a clue as to the radiation shape.It's hard to say what a true point source really sound like - hasn't been many done - if any..
No it doesn't. But my bet is that the more point source, the better image. I see a true point source as the "grail"- yes hyper smooth, even, 360 omni. I will attempt to build a pair in one way I haven't tried yet 🙂 - with a big nod to Amar. But there is a distinct difference between the HornFlower and my corner floor2ceiling line sources for sure - that are since a few days at the same location for the first time. Advantage HF.
Sorry for the OT - the mod started it ;-D
//
Sorry for the OT - the mod started it ;-D
//
Remind me not to take you anywhere 😉
I suspect that for the few different points you just made there is a more circumstantial explanation, sometimes more than one.. but carry on.
I suspect that for the few different points you just made there is a more circumstantial explanation, sometimes more than one.. but carry on.

I feel now I might probably have misunderstood you or written something offending. I don't grasp the gist of "Remind me..." - sorry for my limited language skills. For the rest of #24 I cant tie the comments to what I wrote in #23. Sorry again and I hope you didn't found the "mod" comment insulting in any way...
/
/
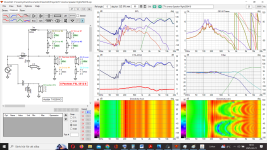
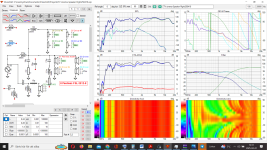
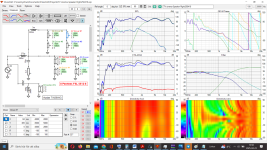
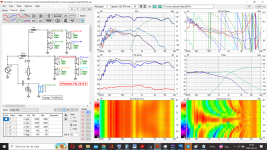
Here is the simulations for the xover. (think i mixed them up before, my head was spinning after a long day)Right click the directivity plot and choose polar map. Right click on the impedance plot and choose directivity chart. Right click on the impedance plot and choose polar map.
Named Polar 1 is just the xover with our settings.
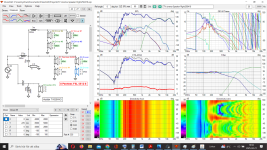
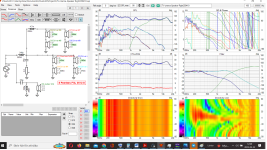
Polar 1 inverted tweeter, is the same but with inverted tweeter.
Polar 2 is the same BUT with all drivers unmuted.
Polar 3 is the same but with 24 dB on midrange insted of 12 dB (as polar 1)
Can you see something on this polars ?
For me its just like a rainbow but not as pretty.
Attachments
Y should be set for the drivers and off axis vertical measurements included would put the project into reality.
I have set the Y for the drivers, as i understand it.Y should be set for the drivers
x,y and z should be set. The tweeter is set to 0,0,0.
https://www.diyaudio.com/community/attachments/measurement-prep-png.1009708/
As you speaker don't have a flat baffle, you also should set z. ("depth")
X=0 is Ok as all are on a vertical line on the baffle.
//
https://www.diyaudio.com/community/attachments/measurement-prep-png.1009708/
As you speaker don't have a flat baffle, you also should set z. ("depth")
X=0 is Ok as all are on a vertical line on the baffle.
//
It was a fun response to your joke. It did not translate well. I was not offended 🙂I don't grasp the gist of "Remind me..." - sorry for my limited language skills.
You said - [my bet is that the more point source, the better image. I see a true point source as the "grail"]For the rest of #24 I cant tie the comments to what I wrote in #23.
..and I said it will be circumstantial. This means you can find good results the way you are going but it is not because of the point source itself, but because of other things.
It isn't straightforward to translate images to sound. I don't think you should focus on these unless you are getting something out of them.Can you see something on this polars ?
For me its just like a rainbow but not as pretty.
I would unmute the woofers before assessing the polars. I'd look for areas that stand out as missing or too strong, maybe you can optimise the line array that way by trying the woofers alone. I'd then see whether the tweeter makes an improvement or ensure it does the least damage when crossing.
This is the data based way to ensure you blend the two radiation styles and to assess them separately, it saves you taking measurements at different places around the room. The other way is to listen. If you EQ to your liking and there are outstanding non flat areas in the listening axis EQ it can be a sign of off-axis problems.
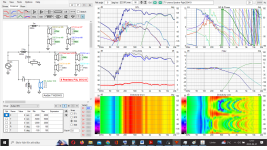
I try to learn a little about interpret polars, and change to +-90 degrees insted of 180.It isn't straightforward to translate images to sound. I don't think you should focus on these unless you are getting something out of them.
I would unmute the woofers before assessing the polars. I'd look for areas that stand out as missing or too strong,
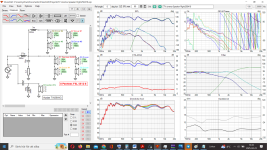
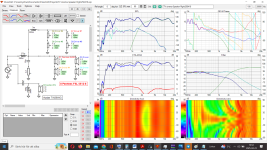
Here is without the woofers (woofers muted)
And anotherone with woofers and some changes in the xover.
In your eyes better?...same?...worse?
regards John
Attachments
Ahhh, i have missed the - at the lowest woofer.You have woofers at..
795m
470m
305m
140m
----T----
-140m
-305m
-470m
-630m
But woofers also muted so should not affect polar?
Last edited:
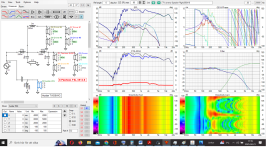
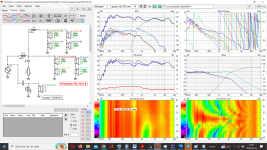
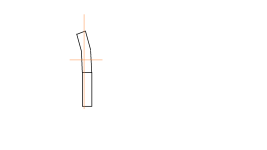
Okey now for the first time, i also put the X-axis in VituaXcad.The muted ones may be leaving holes in the coverage.
Hard for my brain with this curved speaker, but i hope its right.
EDIT: Skiss on speakers X axis from the side.
Attachments
Last edited:
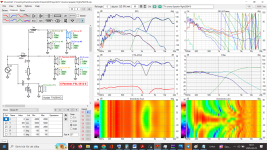
Now when i have follow your advise and have put the Y and X axis in the simulation, have you any comment of what "you see" ?x,y and z should be set. The tweeter is set to 0,0,0.
https://www.diyaudio.com/community/attachments/measurement-prep-png.1009708/
As you speaker don't have a flat baffle, you also should set z. ("depth")
X=0 is Ok as all are on a vertical line on the baffle.
- Home
- Loudspeakers
- Multi-Way
- Is any of these 2 xover technically preferable?