I am a bit confused what I am looking at in the video?slow motion port air movement video 3: progressive geometry (elliptic wall) port
here comes the next slow motion video, with the "progressive geometry port".
I used the exising port of chamber 1 and attached it to the lower tuned chamber 2.
the tuning only changes very slightly (it's 1-2 Hz lower):
View attachment 1273902
as I experienced earlier this port behaves quite well, but only up to a certain level and more importantly only down to a certain frequency.
this effect follows the strouhal-number explanation of roozen, but it is much more pronounced.
once the frequency gets really low (and thus the particle displacement distance gets big) the H3 distorsion, compression and the low frequency noise raises very rapidly. I suspect besides a relationship between displacement distance and exit radius there is another relationship between port length and displacement distance. I will investigate further!
for this rather small port and also the one in my next video (small straight tube) I used input levels from 0,125 V to 4 V rms, including 2,83 V rms.
above 4 V the particle movements are so quick that it does not make much sense to show them on 120 fps videos.
also, there is very low modulated chuffing noise, thus the slowed down audio is not very revealing, therefore it's not included here.
by the way: the strouhal numbers refer to the port exit radius.
at the end of each input voltage section there is the correlating spectrum graph.
here is the respective 1 - 4 V chuffing graph:
View attachment 1273903
I suspect the low frequency noise is related to a circular turbulence inside the exit flange which can be seen in the video at higher levels.
also note that this port geometry seems to be quite tolerant regarding longitudinal resonance mode. there is only a very slight low peak at levels that are not usable for music reproduction anyway.
From the perspective of the video, the particles are being put in from the top?
Yes, that was the best way to get visible particle movement.the particles are being put in from the top?
As I wrote in the introducing text (I know it's a bit too much text!) there is a general gravital movement of water mist and flour particles towards the port, which is unrelated to the oscillation.
in post #367 you can see a picture of my video setup!
Thanks, my apologies for not reading well.
We are currently moving house, so pretty tired atm.
A bit of an issue at doing it this way, is that there doesn't seem to be a nice steady state picture.
The flow from one side disrupts the visuals a bit.
As you described yourself as well 🙂
I think it's a really great idea to get into contact with these YT guys with highspeed cameras.
Or maybe you can find an university close by?
Is there an 'end goal' in mind for these videos? Of course we'd all like to know how to make a low noise port, I'm wondering if there is a piece of the puzzle you specifically wish to capture and solve by these visualisations which canot be captured by sound analysis? Or is it just because its fascinating?
I hope that doesn't sound like I'm saying 'whats the point?' Because I'm totally here for the fascinating visuals!
I hope that doesn't sound like I'm saying 'whats the point?' Because I'm totally here for the fascinating visuals!
no problem, hope you can find some rest!Thanks, my apologies for not reading well.
We are currently moving house, so pretty tired atm.
yes, there is 😊Is there an 'end goal' in mind for these videos?
I'll try to sum it up a bit below.
I am trying not to interpret to much into these videos yet, because honestly I am not so sure about the first assumptions and I keep discovering new effects every time i look at them!
agreed - I am already thinking about a title change... maybe: "investigating port resonance absorbers and port geometries".this thread started with port resonances.
summing up my goals for this thread and it's research
as @Tenson and @b_force mention above it may be sensible to set the goal or direction for my investigations, that also helps me stay on track!some general asssumptions and remarks:
- ported enclosures have a bad reputation, there seems to be a general consensus that bass reflex enclosures are just a mediocre compromise to compensate for too small woofers or to achieve high SPL.
- the shape of a port has an immense influence regarding chuffing, compression, resonance behaviour.
- there seems to be a lack of knowledge and information (in the diy community, at least) of how to shape a good port
- there are just very rough rules of thumb, such as max air speed in the port (which I will prove is not the most influencing factor).
- to be on the safe side many just chose "bigger is better" (so did I and it's a bad idea, at least for midwoofers in 2-way speakers)
port resonance absorbers:
I think I found a sensible way to include port mode resonance absorbers without the negative side effects, such as chuffing or loss of output.while investigating I also found out:
- the most annoying effect of longitudinal resonance is the excitation of it through high airspeed turbulence at the port ends. it creates a whistle sound modulated by (helmholtz resonance) bass frequencies.
- generously flanged port geometries are less prone to longitudinal resonances.
- it is (of course) a good idea to shorten the port as much as possible and eventually get the port resonance out of the midwoofer passband.
port geometry:
the important dimension of a port seems to be the flange diameter. by reducing the central port diameter it is possible to reduce the port length considerably and have positive effects:- reduced port length, leading to a higher resonance frequency (possibly out of the passband)
- less resonant length/diameter ratio
my goal for the videos:
I am interested to correlate specific port noise / compression / distorsion (H3) effects to specific turbulent air movements and by doing so being able to optimize the port geometry. more specific I would like to find better rules of thumb, eventually setting up a formula to calculate the minimum port diameter/s.what the videos showed up until now:
the turbulences visible in the videos are generally already much too noisy for any sensible music reproduction. it can be a first step to distinguish different effects.for example:
the hard edge ports tend to generate small and increasing turbulences just outside the port edge (also seems to be connected to bernoulli effect). this seems to generate a broadband noise, starting at very low levels and increasing steadily. this turbulence also excites the longitudinal port resonance. for higher levels the noise gets quite loud but there is still some useful port output.
a flanged port end are much less noisy at low levels. however, once the turbulent airflow starts, the port function is much more heavily affected.
the very small elliptic wall port ("progressive geometry" named after the progressively increasing cross section) behaves well, but looses most of it's function above certain air particle displacement length.
my very next goal:
I'd like to find the limiting factor for the "progressive geometry port".maybe I already found it, see next post...
influence of air particle displacement for the excitement of low frequency noise
here are three RTA spectrum graphs for the same "progressive geometry port", but for different frequencies and 1 - 2 - 4 - 8 V input each.
first two graphs show the port mounted to the higher tuned chamber 1 that provides output between 50 - 100 Hz.
the third graphs shows the port mounted to the lower tuned chamber 2 with a single 35 Hz output peak.
find here the post showing outputs of both ports!
1. chamber 1 port with 100 Hz output:
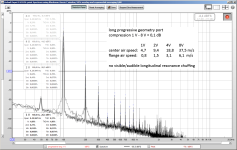
no low frequency noise, just a slight widening of output peaks at 8 V.
2. chamber 1 port with 50 Hz output:
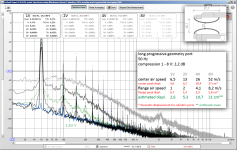
low frequency noise starts above 2 V input!
longitudinal resonance faintly excited for 4 and 8 V.
please disregard the displacement numbers in the graph! David McBean corrected my wrong formula!
3. chamber 2 port with 35 Hz output:
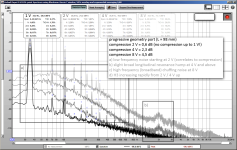
low frequency noise starts above 1 V input.
longitudinal resonance excited for 4 and 8 V.
comparison table:
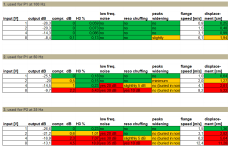
there is a strong correlation between all negative effects (compression, low frequency noise, H3 distorsion, resonance chuffing) and the air particle displacement ("displacement", not to be mixed up with diaphragm/voice coil displacement!).
if the displacement distance is related to the flange surface radius (2,4 cm in this case), the "strouhal number" reference seems to match perfectly.
once the particle displacement comes near the port flange radius the usability of the port suffers heavily (see red marked fields).
My addition to the "strouhal number" explanation in the roozen paper is that (as far as I understand until now) it is the flange diameter that counts.
edit:
1. please note that the air speed does not seem to be directly correlated to negative effects. however, the air speed is used to calculate the displacement!
2. the dB numbers for the low frequency noise and for chuffing resonance peak are rough estimations, just looking at the graphs.
3. the increase of H3 distorsion may be partially due to the driver excursion exceeding xmax. on the other hand the bandpass enclosure should reduce this distorsion to a certain degree...
Last edited:
I keep repeating the positive effects of smaller ports ....
when I started this loudspeaker project nearly 20 years ago I used a generously sized plotter paper cardboard tube with 5 cm diameter as port.
I used speaker workshop to measure the response of the midwoofer and initially thought I had a bad measurement setup because of strange peaks and dips in the midrange area. but the measurements were accurate - I just had quite bad interferences between woofer and (front) port.
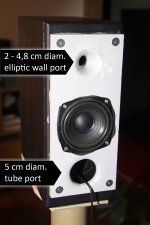
I now added the small "progressive geometry port" (resulting in a slightly lower tuning, replicated by also making the big tube port slightly longer) and closed one port each to measure the different responses:
(edit: no dampening material was used in the enclosure for this test!)

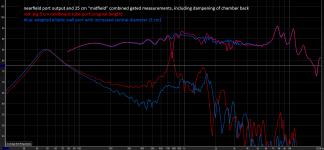
the influence of the port and enclosure resonances exiting the oversized port are clearly visible.
the farfield measurement is gated, so the peaks and dips appear slightly smoothed and might be much more severe in reality.
the interferences are in a quite important and sensitive frequency area and will be influenced by the vertical angle (thus influencing the energy response).
the small port is still not optimized, see previous post with a similar port. at around 50 Hz the port starts to excite low frequency noise at low levels.
A slightly bigger port for this speaker is already in production!
increasing the port diameter combines two positive effects, leading to a much bigger strouhal number:
combined the strouhal number should therefore increase by a power of 3.
this is why I think finding a calculation method is important - it's difficult to imagine exponential growth!
... so here come the measurements:by reducing the central port diameter it is possible to reduce the port length considerably and have positive effects:
- reduced port length, leading to a higher resonance frequency (possibly out of the passband)
- less resonant length/diameter ratio
differences of a big and small port for a small 2-way midwoofer
this is my small work-in-progress 2-way loudspeaker that triggered this whole thread and will be optimized using a dedicated port design.when I started this loudspeaker project nearly 20 years ago I used a generously sized plotter paper cardboard tube with 5 cm diameter as port.
I used speaker workshop to measure the response of the midwoofer and initially thought I had a bad measurement setup because of strange peaks and dips in the midrange area. but the measurements were accurate - I just had quite bad interferences between woofer and (front) port.
I now added the small "progressive geometry port" (resulting in a slightly lower tuning, replicated by also making the big tube port slightly longer) and closed one port each to measure the different responses:
(edit: no dampening material was used in the enclosure for this test!)


the influence of the port and enclosure resonances exiting the oversized port are clearly visible.
the farfield measurement is gated, so the peaks and dips appear slightly smoothed and might be much more severe in reality.
the interferences are in a quite important and sensitive frequency area and will be influenced by the vertical angle (thus influencing the energy response).
the small port is still not optimized, see previous post with a similar port. at around 50 Hz the port starts to excite low frequency noise at low levels.
A slightly bigger port for this speaker is already in production!
increasing the port diameter combines two positive effects, leading to a much bigger strouhal number:
- bigger port diameter proportionally increases the strouhal number.
- the port cross section surface increases by square and thus has an even stronger effect on the air particle displacement distance.
combined the strouhal number should therefore increase by a power of 3.
this is why I think finding a calculation method is important - it's difficult to imagine exponential growth!
Last edited:
Great results @stv ! The green trace is certainly a nice result compared to any speaker. KEF is at about -20 dB with their best designs and I consider them one of the benchmarks.
I do have some (hopefully constructive) criticism about the test method. I think you have made the same mistake I did. I moved the port position inside the speaker cabinet and attributed the changes to the port design. I did not appreciate just how huge the affect of port and driver position in the cabinet is, nor how critical to small changes. I could move the woofer or port by 10mm and see multiple dB of change in the resonances.
The peaks in the red plot at 450 Hz and 550 Hz look like cabinet modes. The fact there is a null in the response on the green curve suggests the internal end of the green port is in a pressure node while the end of the red port is at a pressure anti-node. This can be due to the different length of the ports or non-symmetrical placement of the baffle.
Is the woofer exactly at the mid-point of the cabinet height? If not, this will also affect the port above and below differently.
As the port lengths are different I don't see any way to make a truly' fair' test other than mounting them on the outside face of the baffle at the same location.
Of course, none of this changes the reality that the green port as you have it installed is giving a very nice result!
Here is my small test speaker with the woofer 20mm above or below vertical mid-point. Same port and port position.

P.S. I did not have a lot of luck accurately modelling these effects in AKABAK. As your port is in the baffle it would be faster for you to make a baffle with a plate that houses the port and you can slide it around to see the effect of different positions. Same for the baffle in general, to vary the woofer location.
I do have some (hopefully constructive) criticism about the test method. I think you have made the same mistake I did. I moved the port position inside the speaker cabinet and attributed the changes to the port design. I did not appreciate just how huge the affect of port and driver position in the cabinet is, nor how critical to small changes. I could move the woofer or port by 10mm and see multiple dB of change in the resonances.
The peaks in the red plot at 450 Hz and 550 Hz look like cabinet modes. The fact there is a null in the response on the green curve suggests the internal end of the green port is in a pressure node while the end of the red port is at a pressure anti-node. This can be due to the different length of the ports or non-symmetrical placement of the baffle.
Is the woofer exactly at the mid-point of the cabinet height? If not, this will also affect the port above and below differently.
As the port lengths are different I don't see any way to make a truly' fair' test other than mounting them on the outside face of the baffle at the same location.
Of course, none of this changes the reality that the green port as you have it installed is giving a very nice result!
Here is my small test speaker with the woofer 20mm above or below vertical mid-point. Same port and port position.
P.S. I did not have a lot of luck accurately modelling these effects in AKABAK. As your port is in the baffle it would be faster for you to make a baffle with a plate that houses the port and you can slide it around to see the effect of different positions. Same for the baffle in general, to vary the woofer location.
Last edited:
By moving the woofer you are changing how much each acoustic resonance is driven but the frequency shouldn't change. This can be seen fairly well in the plot despite the lowish frequency resolution for high Q resonances.
In a BEM simulation the acoustic resonant frequencies should be well predicted. The main Helmholtz resonance will be missing because the physics for that is not in the model. The magnitudes of the resonances are likely to be poor because the aerodynamic sound sources within the cabinet (and outside) are missing with only the sound from the cone included. Even then only the velocity next to the cone will be correct with the pressure likely to be well off (need both pressure and particle velocity for a sound waves). Nonetheless you should be able to see resonances at the same frequencies as the measurements. If they are not present then something is likely to be off with the BEM simulation. This may well be fixable with further effort though the possibility exists perhaps not with a closed code.
In truth BEM isn't a particularly appropriate tool to be using for this problem. It could provide useful information but a limited amount which would need interpreting with some care. It probably isn't worth a lot of effort.
The AKABAK website does show some results for a ported speaker by, I believe, adding the physics for the Helmholtz resonance via a lumped model in some way. Not sure how well that is going to work driving the acoustic modes within the cabinet given the real sound sources are distributed which I would expect a BEM code to struggle to represent accurately, The bulk of the sound radiated to the listening position by the port and driver may be fine if port source strength from the lumped model is fine because the distribution outside the cabinet isn't going to matter much with a relatively long wavelength.
A bit off topic but I've just been looking at that example 'SP38' mentioned here: https://www.randteam.de/_Docs/AKABAK/Studies/SP38 vented.pdf
There are a few version in the examples folder. One does not model the cabient interior in BEM. It uses LEM for the port and simply places the radiation component on the baffle front.
However there is an example that models the cabinet interior with BEM and interestingly it does not use a LEM compoment for the vent at all. It simply creates a dedicated domain for the port interior and the output results appear to include the main helmholtz resonance as well as higher resoannces 🤔 I didn't think that was possible without treating the air as compressible. I wish I looked at this example earlier!
I didn't get much from the slides but the appendix here provides some information. The sub-domains are presented as a solution to the well known numerical problem BEM has with thin boundary shapes rather than anything to do with the physics of ports. It rather confirms that modelling a ported cabinet with a single domain with AKABAK is not expected to work though it may in other BEM codes that have introduced numerical treatments to handle thin shapes.
The sub-domains are 3 separate BEM simulations that are only coupled via the interfaces. This is an approximation that reduces the numerical size of the problem as well as removing issues to do with thin boundaries. I need to think some more about how the inclusion of the interfaces might be coupling the inside and the outside via the port. Wondering if I may have misunderstood what is and is not included with linear acoustics when it comes to ports. Interesting stuff.
The sub-domains are 3 separate BEM simulations that are only coupled via the interfaces. This is an approximation that reduces the numerical size of the problem as well as removing issues to do with thin boundaries. I need to think some more about how the inclusion of the interfaces might be coupling the inside and the outside via the port. Wondering if I may have misunderstood what is and is not included with linear acoustics when it comes to ports. Interesting stuff.
I'll play with it some more when I have free time and let you know if anything interesting results.
The green walls mean an impedance has been applied and is inside the port as well as the cabinet. It is not a complex number with a reactive component though, just a small amount of damping as a real number.
The green walls mean an impedance has been applied and is inside the port as well as the cabinet. It is not a complex number with a reactive component though, just a small amount of damping as a real number.
I was planning to test this as well! 🙂Great results @stv ! The green trace is certainly a nice result compared to any speaker. KEF is at about -20 dB with their best designs and I consider them one of the benchmarks.
I do have some (hopefully constructive) criticism about the test method. I think you have made the same mistake I did. I moved the port position inside the speaker cabinet and attributed the changes to the port design. I did not appreciate just how huge the affect of port and driver position in the cabinet is, nor how critical to small changes. I could move the woofer or port by 10mm and see multiple dB of change in the resonances.
The peaks in the red plot at 450 Hz and 550 Hz look like cabinet modes. The fact there is a null in the response on the green curve suggests the internal end of the green port is in a pressure node while the end of the red port is at a pressure anti-node. This can be due to the different length of the ports or non-symmetrical placement of the baffle.
Is the woofer exactly at the mid-point of the cabinet height? If not, this will also affect the port above and below differently.
As the port lengths are different I don't see any way to make a truly' fair' test other than mounting them on the outside face of the baffle at the same location.
Of course, none of this changes the reality that the green port as you have it installed is giving a very nice result!
Here is my small test speaker with the woofer 20mm above or below vertical mid-point. Same port and port position.
View attachment 1275515
P.S. I did not have a lot of luck accurately modelling these effects in AKABAK. As your port is in the baffle it would be faster for you to make a baffle with a plate that houses the port and you can slide it around to see the effect of different positions. Same for the baffle in general, to vary the woofer location.
Mostly because I was already expecting some relationship here as well.
Recently moved house, one of the reasons why I wasn't able to step in with some results as well.
Internal cabinet resonances can be very easily seen and measured with the Burst Decay mode in ARTA.
It's handy to fully block AND fill the port (or measure the cabinet first without the port at all).
Btw, how long is that port?
Last edited:
yes, I made a temporary baffle and added a second hole for the second port. one of the ports was closed for each measurement.The cabinet only contains two ports with one blocked, a midwoofer and no tweeter?
I fully agree - there are several influences for the resonance behaviour and they must be considered.I do have some (hopefully constructive) criticism about the test method.
both my ports have the same distance to the driver, but the longer 5 cm cardboard tube's interior end is further inside the box than the shorter elliptic wall port.
I 3d-printed a new elliptic wall port for my test case, this time with a 3 cm interior diameter, lenght 9,4 cm (first mode around 1.7 kHz).
the existing cardboard tube port is 19 cm long, 5 cm diameter (first mode around 800 Hz).
tuning matches very well, this was confirmed by an impedance measurement.
here is a new comparison between these port variants. this time I inserted two sheets of foam absorption material at the back of the box to better "isolate" the port resonances:
Last edited:
So first mode is at roughly 1kHz, followed by 2kHz, 4kHz etcPort is about 170 mm with some flare
Btw, by only blocking a port, you create a tube with one closed end.
Resulting in a resonance at a lower frequency.
slow motion port air movement video 4: small straight hard-edge port
one more video (the last one of the 120 fps videos)!
this is a small straight tube port, protruding outside the box, this is similar to a straight tube end inside the box but I suspect there is a substancial difference of pressure relations between inside the box and outside.
the hard edge creates a small steady circular airflow (and subsequently a central directed airflow "jet" towards the outside) from very low levels up. this seems to be excited by the bernoulli effect for outward air flow and by the low pressure in the port for the inward directed air flow.
this could be the cause for the broadband noise created by straight hard edge ports. this noise starts at low levels and increases steadily, in contrast to the low frequency noise of big-flared ports that starts at a very specific level (and related particle displacement) and rises very steeply.
I added sound recordings for the 2 V and 4 V inputs. there is no video material for these levels, because it does not provide meaningful slow motion footage (particle displacement too big).
- Home
- Loudspeakers
- Multi-Way
- Investigating port resonance absorbers and port geometries