yes, I made a temporary baffle and added a second hole for the second port. one of the ports was closed for each measurement.
Can you please provide the cabinet dimensions, dimensions of the cylindrical port, location of port on baffle, wall and baffle thickness and a link to the driver for a rough simulation? I rather suspect I have got a fair sized blob of egg on my face concerning BEM capabilities w.r.t. to ported enclosures so I am going to start pulling together a simple prototype BEM code this afternoon to confirm. I also want to check the pros and cons of coupling the BEM solution regions in the manner of the AKABAK example above. The pros are fairly clear but the size of the cons less so. The prototype uses rectangular cells to minimise the amount of coding while sorting out algorithms so the port will be rectangular rather than cylindrical so precision not important at this stage. Thanks.
That's a good point. I suppose while not open to the exterior environment it might still impact the results.So first mode is at roughly 1kHz, followed by 2kHz, 4kHz etc
Btw, by only blocking a port, you create a tube with one closed end.
Resulting in a resonance at a lower frequency.
I don't know how comfortable you are with CAD but if can be of help by providing a simple mesh or STEP file for the simulation let me know.Can you please provide the cabinet dimensions, dimensions of the cylindrical port, location of port on baffle, wall and baffle thickness and a link to the driver for a rough simulation? I rather suspect I have got a fair sized blob of egg on my face concerning BEM capabilities w.r.t. to ported enclosures so I am going to start pulling together a simple prototype BEM code this afternoon to confirm. I also want to check the pros and cons of coupling the BEM solution regions in the manner of the AKABAK example above. The pros are fairly clear but the size of the cons less so. The prototype uses rectangular cells to minimise the amount of coding while sorting out algorithms so the port will be rectangular rather than cylindrical so precision not important at this stage. Thanks.
it's open to the inside of the cabinet 😉That's a good point. I suppose while not open to the exterior environment it might still impact the results.
I don't know how comfortable you are with CAD but if can be of help by providing a simple mesh or STEP file for the simulation let me know.
Thanks. While sorting out the algorithms with prototype software the geometries are simple and tend to be defined by hand. When I have settled on the algorithms then the next stage is generalising the geometry by deriving and implementing lots of terms and improving the efficiency to handle larger problems. A bit of grind and less fun than playing with algorithms but required to solve realistic problems. It is at this stage STEP files will be useful but bringing forward the BEM stuff has pushed that time further away.
attached a plan showing the exact loudspeaker setup for the last test. dimensions are all in mm.Can you please provide the cabinet dimensions, dimensions of the cylindrical port, location of port on baffle, wall and baffle thickness and a link to the driver for a rough simulation?
the TSP come from hobby hifi (german magazine) and seem to be quite accurate.
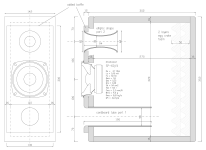
the added elliptic wall port is installed where the former tweeter was.
the 50 mm interior diameter cardboard port has a wall thickness of about 3 mm.
the 3d printed elliptic wall port was 3d printed with PLA, thickness 2 mm. the relevant interior shape follows a rotated half-ellipse, long axis 94 mm, short axis 30 mm, thus opening diameter 60 mm, central diameter 30 mm.
one of the ports was each stuffed airtightly for measurement.
(further documentation sent to you via personal message!)
Last edited:
FWIW I tried to sim my small speaker with the port having its own domain and an interface on each end. It does kind of work, but the results (both main tuning freq and additional resonances) vary a lot simply depending where I place the interface meshs. None of my sims had the same resonance frequencies at the port output as the real test example. I feel like it might work better for a round or box shaped port, rather than a slot port with boundaries very close to each other since we know that can cause issues with BEM sims.
Yes the interfaces introduce an approximation. In the full scheme every element is influenced by the value of every other element with closer elements having a larger influence than ones further away. When the interfaces are introduced the influence of all the elements on the other side is collected and distributed over the small number of elements on the interface. This is likely fine for elements that are far away but less so for those that are close. If the interface occurs where there are strong gradients like at the curved ends of your port this is likely to make the approximation worse.
The presented AKABAK simulations looks reasonable but I noticed that although the cabinet has thickness the port doesn't. That is something I wanted to look at with the prototype BEM code I am cobbling together. There are alternative ways of handling the thin shape numerical issues that don't introduce significant approximations but they are more complex and require more CPU time.
BEM is undeniably useful for external acoustics but simulations of the acoustics within the cabinet is often likely to be better handled with a method that uses volume elements. This will enable the inclusion of more relevant physics like stuffing, distributed sources, higher resolution, vortical motions, etc...
I kept this in mind and finally did a test!A flat port has a lot more issues with the boundary layer effect.
Resulting in more resistance, therefore Q factor of port goes down.
This can be easily measured and seen with an impedance measurement.
My experience is that a slot port (flat port) can be very tricky and most certainly doesn't behave textbook wise because of the things I just mentioned.
Obviously all compared to the same Sd to like a good round port.
Because of the length/width ratio, they have a tendency to do a bit better in terms of port resonances (aka standing wave)
I took the small 3d printed port for chamber 1 and replicated the flange and center cross section surfaces, but with a very thin rectangular shape (6 mm):
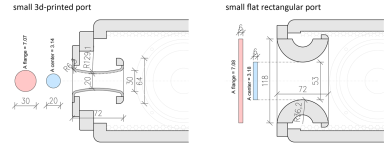
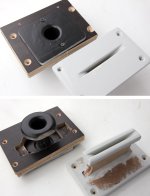
the impedance measurements for different amp output voltages (I should add, this is the amp output which will be reduced by the 8 ohm impedance measurement resistor!)
small round 3d printed port:
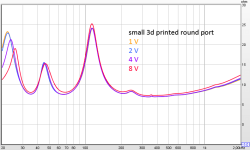
and the small flat port:
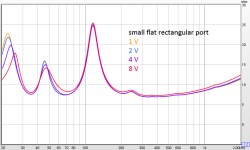
there is a slight difference for the 4 V and 8 V middle peak and upper valley. the flat port seems to restrict the airfllow slightly more.
furthermore there might be a slight tuning difference between the ports (upper peak!).
at low levels the ports seem to behave quite similar, despite the very different flow surfaces. the boundary layer effect doesn't seem to have a huge influence.
please disregard the lowest 25 Hz peak. this refers to the chamber 2, which did not change.
however, as I noticed before: the small chamber 1 ports restricts the airflow below resonance for high levels and thus lowers the lowest impedance peak.
now, to check for the turbulent airflow tendency, the chuffing-RTA-spectrum graphs, for 100 Hz and 50 Hz each:
100 Hz small round 3d printed port:

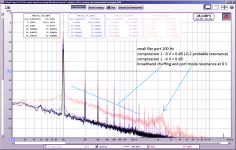
100 Hz small flat port:
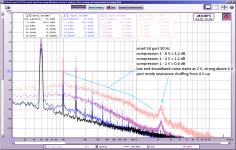
50 Hz small round 3d printed port:
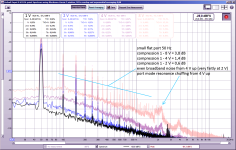
50 Hz small flat port:
with 100 Hz the round 3d printed port behaves very well (strouhal number high due to higher frequency).
the flat port has turbulent airflow at 8 V, resulting in broadband noise and port mode resonance chuffing.
I suspect the loss of port Q with higher levels (see impedance curves) is mainly due to the turbulent airflow.
still, both ports do not compress noticably.
at 50 Hz the strouhal number is reduced and turbulent airflow can be seen for both ports.
the flat port behaves slightly better regarding noise but worse at H3 distorsion.
keep in mind: with these noise levels the ports are not really usable for serious music reproduction at levels above 1-2 V, if tuned around 50 Hz.
compression is very similar for both ports.
port resonance chuffing noise is less pronounced for the flat port (as b_force mentioned above!)
my conclusion:
the issue with both small ports is the turbulent airflow at high air displacement distances.
in relation to that the boundary layer effect does not seem to affect oscillating air very much.
also refer to @andy19191 's explanation of boundary layer thickness in post #302 and my comparison of bigger 3d printed and similar flat ports in posts #157, #165, and #222!
You can little estimate air boundary layer thicknesses from test I made with port filled of drinking straws 3-8 mm diameter, on post https://www.diyaudio.com/community/...rbers-and-port-geometries.388264/post-7445486
I find the impedance peak around 45Hz changing quite a bit!I kept this in mind and finally did a test!
I took the small 3d printed port for chamber 1 and replicated the flange and center cross section surfaces, but with a very thin rectangular shape (6 mm):
View attachment 1276680
View attachment 1276687
the impedance measurements for different amp output voltages (I should add, this is the amp output which will be reduced by the 8 ohm impedance measurement resistor!)
small round 3d printed port:
View attachment 1276681
and the small flat port:
View attachment 1276682
there is a slight difference for the 4 V and 8 V middle peak and upper valley. the flat port seems to restrict the airfllow slightly more.
furthermore there might be a slight tuning difference between the ports (upper peak!).
at low levels the ports seem to behave quite similar, despite the very different flow surfaces. the boundary layer effect doesn't seem to have a huge influence.
please disregard the lowest 25 Hz peak. this refers to the chamber 2, which did not change.
however, as I noticed before: the small chamber 1 ports restricts the airflow below resonance for high levels and thus lowers the lowest impedance peak.
now, to check for the turbulent airflow tendency, the chuffing-RTA-spectrum graphs, for 100 Hz and 50 Hz each:
100 Hz small round 3d printed port:
View attachment 1276684
100 Hz small flat port:
View attachment 1276686
50 Hz small round 3d printed port:
View attachment 1276683
50 Hz small flat port:
View attachment 1276685
with 100 Hz the round 3d printed port behaves very well (strouhal number high due to higher frequency).
the flat port has turbulent airflow at 8 V, resulting in broadband noise and port mode resonance chuffing.
I suspect the loss of port Q with higher levels (see impedance curves) is mainly due to the turbulent airflow.
still, both ports do not compress noticably.
at 50 Hz the strouhal number is reduced and turbulent airflow can be seen for both ports.
the flat port behaves slightly better regarding noise but worse at H3 distorsion.
keep in mind: with these noise levels the ports are not really usable for serious music reproduction at levels above 1-2 V, if tuned around 50 Hz.
compression is very similar for both ports.
port resonance chuffing noise is less pronounced for the flat port (as b_force mentioned above!)
my conclusion:
the issue with both small ports is the turbulent airflow at high air displacement distances.
in relation to that the boundary layer effect does not seem to affect oscillating air very much.
also refer to @andy19191 's explanation of boundary layer thickness in post #302 and my comparison of bigger 3d printed and similar flat ports in posts #157, #165, and #222!
Worst of all, it moves upwards.
The impedance of the rounded port stays much more even.
It's kinda hard to really conclude if it's just only turbulence or boundary layer.
If I am correct, the boundary layer would basically make the port smaller (in surface area), resulting in a lower tuning frequency and not one that goes higher.
That could be an indication that it's not the boundary layer like you said. 🙂
This was done with exactly the same driver I assume?
It's very interesting to see that the noise levels at 50Hz seem to be lower with the slotted port, while the harmonic peaks are much higher.
I wonder if there would be a difference when flaring the large vs. small sides of the rectangle slot port?
It seems to me that the rate of growth for the small face flare must be significantly faster than if the large face was flared. In other word by flaring the large face, the flare can be more gentle to achieve the same mouth area. Does that make sense? The slower rate of flare might be an advantage in avoiding stream separation.
It seems to me that the rate of growth for the small face flare must be significantly faster than if the large face was flared. In other word by flaring the large face, the flare can be more gentle to achieve the same mouth area. Does that make sense? The slower rate of flare might be an advantage in avoiding stream separation.
Yes 😊 - my explanation would be:That could be an indication that it's not the boundary layer like you said. 🙂
Small curvature radius of a port shape (=sudden increase in cross section) leads to boundary layer flow reversal and subsequent disruption of laminar airflow.
For straight cut off tubes that happens all the time (even at low level, see video number 4), but remains right outside the end of the port. Tuning does not change much.
A progressively flared port keeps laminar flow up to a certain velocity and air particle movement distance, but then the laminar flow is disrupted inside the flange (see video 3)! The controlled/ laminar oscillating air quantity (=weight) is reduced, thus tuning gets higher.
All parameters except port shape are the same, yes!This was done with exactly the same driver I assume?
Yes! Exactly!The slower rate of flare might be an advantage in avoiding stream separation.
My test was intended to check for negative impact of very thin ports. But your suggestion absolutely makes sense.
The total cross section increase/flare rate remains the same, but the curvature (=air direction change) is much more gentle and might allow reduction of flare flow disruption.
Was that the idea of your test enclosure ports?
Last edited:
Thanks, interesting!boundary layer thicknesses from test I made
influence depending on straw diameter is very clearly visible!
Did you also do impedance measurements as well? At different levels, eventually?
Yeah straws can never be a good thing, lolYou can little estimate air boundary layer thicknesses from test I made with port filled of drinking straws 3-8 mm diameter, on post https://www.diyaudio.com/community/...rbers-and-port-geometries.388264/post-7445486
Not really, haha. That was just a practical consideration of fitting a decent sized port in a cabinet with lots of other bits. I do like the fact the port walls double as internal bracing.Was that the idea of your test enclosure ports?
No, I did not made. My goal was to get port (actually resonator) Q change information from straw diameter, I not changed level.Thanks, interesting!
influence depending on straw diameter is very clearly visible!
Did you also do impedance measurements as well? At different levels, eventually?
I saw this today and thought it was interesting. Note the flip in the harmonic distortion from primarily 2nd order in the low range to 3rd order from around 300 Hz. Then look at the port response. SPL not calibrated.
I guess this does thend to happen with woofers anyway...so not sure if the port is causing it.


I guess this does thend to happen with woofers anyway...so not sure if the port is causing it.
It is, thanks!thought it was interesting
Could you tell me some more about the measurement method? All near field?
I see the following:
- The sligthly falling total response up to 300 Hz rises again above 300 Hz
- the port output drops steeper above 300 Hz
- none of the distorsion graphs seem to follow the port output peaks above 600 Hz considering their respective multipliers
- the H2 distorsion graph is quite even and gets wiggly above 500 Hz. That follows the peak at 1k.
- H3 has a step at ~ 330Hz (thus the H2-H3 flip). Again this just reflects the response peak at 1 kHz, as far as I see. Thus I don't think it's directly related to the port.
- Home
- Loudspeakers
- Multi-Way
- Investigating port resonance absorbers and port geometries