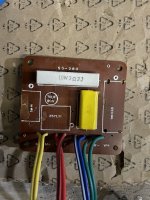
It didn’t make sense for there to be a 2.2k series resistor for the tweeter. It is a 2.2uF metal film capacitorok, have redrawn it, but with 2 multimeters, neither can measure inductance so I’m a bit stuck. I think it’s safe to assume the crossover between tweeter and mid range will be ok, so maybe it’s the resistor I need to look at re levels. Updated schematic is attached. View attachment 1109060
Although an RL filter is a valid form of first order filter. It's been done a number of times as a way to avoid using a capacitor.
And now, after reading up a bit, it looks like the mid is slightly attenuated, but only has a high pass filter applied, which could explain the harshness I am hearing? I could redo the crossover completely, but wondering if I put in a series inductor if it might help.It didn’t make sense for there to be a 2.2k series resistor for the tweeter. It is a 2.2uF metal film capacitor

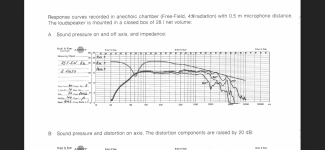
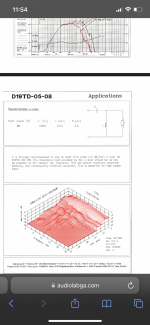
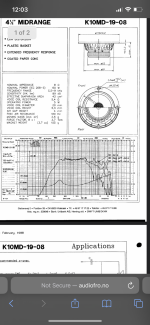
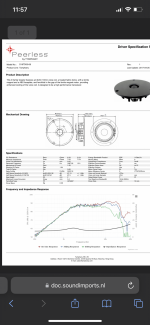
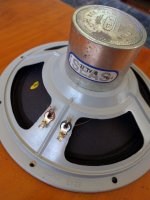
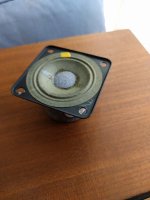
Ok, was thinking I probably should just start this thread again to avoid confusion but I can’t see how to do that. I removed the inductors from the crossover to see if I could get them measured, and luckily for me the circuit board was labelled. But now I am totally confused. The D19 tweeter and K10 mid range both came out of the same box as the crossover. However, based on me looking up some formulas the crossover frequencies look way too high for these drivers. To make things worse, I’m pretty sure the frequency response plot supplied for the original D19 is wrong, as it cuts out at about 10kHz, so I don’t know how reliable the other data like SPL is. There is a later data sheet for the D19 that has very different numbers. See the attachments.
Attachments
-
 013603B1-04C4-4980-9C7A-32DA997F0125.jpeg543.6 KB · Views: 110
 -
 028E7449-7B51-4F7E-BAC5-24202B662C7B.jpeg449.3 KB · Views: 100
 -
 7DBDFDBA-3DAA-4574-917A-5CC9C3DDD377.png466.1 KB · Views: 105
 -
 F8382A77-CFF2-48C1-A87F-CCC856088DDC.png545.6 KB · Views: 112
 -
 3224180E-9E7F-404F-8FAD-22381DDB649D.png526.3 KB · Views: 112
 -
 A86ED479-4CE8-46A2-BDF8-49263C269149.png644.9 KB · Views: 93
 -
 94440C01-77AA-48BE-B352-489527FDA77E.png605.5 KB · Views: 92
 -
 5CFCA9FA-CCC0-452D-9E86-20973F9BC6F9.png498.2 KB · Views: 90
 -
 A480D7D5-30F4-4501-9A2A-AD55462994A8.png573.4 KB · Views: 107
 -
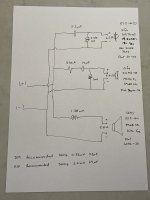 image.jpg345.7 KB · Views: 108
By my calculations the high pass for the mid is around 5 kHz and the tweeter is 7kHz so I must be getting something wrong. for the online calculators, do you use nominal impedance of 8 Ohms, or something from the impedance chart, or the DC resistance?
Re from datasheet. Or not use an online calculator at all.
Highpass K10 at 5k makes no sense. Not even low-pass. The D19 tweeter has gone through revisions from the original Vifa to Tymphany keeping the model alive.
I did try a new XO when you first posted, but it was difficult cause of the K10.
Highpass K10 at 5k makes no sense. Not even low-pass. The D19 tweeter has gone through revisions from the original Vifa to Tymphany keeping the model alive.
I did try a new XO when you first posted, but it was difficult cause of the K10.
I've tried again and this time it's the original D19 Vifa datasheet that causes issues. It looks unbelievable cause the tweeter starts dying from 2khz. 💩
I used instead the Tymphany D19 datasheet.
Anyway, here's a quick and dirty new XO - LR2-LR2 bass-(inverted) mid @ 700hz and LR2-BW3 mid-tweeter @ 3khz.

I used instead the Tymphany D19 datasheet.
Anyway, here's a quick and dirty new XO - LR2-LR2 bass-(inverted) mid @ 700hz and LR2-BW3 mid-tweeter @ 3khz.
Attachments
Yes, it's one decade displaced. That's a well known error but you can still use it if you adjust it.It looks unbelievable cause the tweeter starts dying from 2khz.
Interesting. I kludged in the Vifa D19 datasheet and the XO still works, except for a sensitivity difference between the Vifa (about 90db) and the Tymphany (about 88db). The tweeter attenuation resistor may need to be increased to 3.9ohm or 4.7ohm.

Will be interested to hear how it goes, @Kevviek
Will be interested to hear how it goes, @Kevviek
No, I don't know how to do that yet, but would like to learn.Sorry if it opens a can of worms, but did you include baffle effects?
I know how to model the diffraction curve from Basta, but don't know how to apply (subtract) it to/from the datasheet curve + simulated filter.
I read the sticky design without measurements opening thread again and it doesn't really say how to deal with it rather than describe the phenomenon.
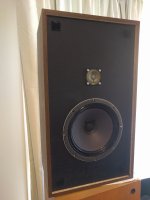
Eyeballing the photo, the cabinet front baffle is approx 464mm H and 308mm W.
Eyeballing the photo, the cabinet front baffle is approx 464mm H and 308mm W.
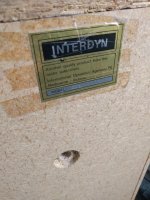
Hi Geoff.Is Aranmar Acoustics in Melbourne still around - I understand they built several speakers in Interdyn's range; they certainly built my 'Pee Wee Monitors'. If they are around, they might be able to assist if you ask nicely.
Geoff
My experience is similar.
Overly bright and harsh in the top end.
Mine are Interdyn 212's 2 Way Speakers with SEAS Woofers & Tweeters.
Fitting a resister completely neutered high/mid and wasn't the answer.
Attachments
For your purposes now, this is what you need to do. It is not called subtracting, but multiplying.from Basta, but don't know how to apply (subtract) it from the datasheet curve.
If you can get the baffle response and the woofer response in an *.frd file, eg...
Then you can multiply them. Do this for each driver. You can scale them at the same time (make it the same amount for each).
Whoah, quite a bit to take in. Didn't even know there was a calculator tool. What I had tried was using the merge tool to combine the simulated diffraction with the datasheet curve. There didn't seem a way to export that as a new frequency response file, so I traced it manually. I'll try this other way.
Need some help.
@Kevviek can you measure the front baffle Height and Width in mm?
@AllenB - questions about applying the diffraction curve to the woofer's datasheet curve.
You said to use the calculator tool in vcad, to multiply A * B curves, and to scale them identically.
This is where I'm stuck.
First, I use The Edge and I get this - the curve starts at 0db, 200hz reads +3.23db

Next I use the vcad diffraction tool and get this. Curve starts at 0db and 200hz reads 3.5db

Finally, I used Jeff Bagby's Diffraction spreadsheet (can only run in OpenOffice so macros don't work) and get this.
Curve starts at -6db and 200hz is about -3.5db.

I can export each diffraction curve so that's fine.
So the remaining step is to use the vcad calculator and multiply the woofer datasheet curve with one of the diffraction curves.
When I do this with The Edge curve, the result gives 200hz at 94db, where the datasheet value at 200hz is 90.4db.
This is wrong, yes? Cause we know the diffraction will cut the amplitude.

When I multiply the Jeff Bagby curve (where diffraction is modeled as a loss), 200hz reads 87db. This is correct, yes?

So...shouldn't the Edge + Vcad curves (that start at 0db), do they need to have their scale set to -6db before multiplying?
You said the scale should be set the same for the diffraction curve and datasheet curve....so I'm unclear.
Thanks.
@Kevviek can you measure the front baffle Height and Width in mm?
@AllenB - questions about applying the diffraction curve to the woofer's datasheet curve.
You said to use the calculator tool in vcad, to multiply A * B curves, and to scale them identically.
This is where I'm stuck.
First, I use The Edge and I get this - the curve starts at 0db, 200hz reads +3.23db
Next I use the vcad diffraction tool and get this. Curve starts at 0db and 200hz reads 3.5db
Finally, I used Jeff Bagby's Diffraction spreadsheet (can only run in OpenOffice so macros don't work) and get this.
Curve starts at -6db and 200hz is about -3.5db.
I can export each diffraction curve so that's fine.
So the remaining step is to use the vcad calculator and multiply the woofer datasheet curve with one of the diffraction curves.
When I do this with The Edge curve, the result gives 200hz at 94db, where the datasheet value at 200hz is 90.4db.
This is wrong, yes? Cause we know the diffraction will cut the amplitude.
When I multiply the Jeff Bagby curve (where diffraction is modeled as a loss), 200hz reads 87db. This is correct, yes?
So...shouldn't the Edge + Vcad curves (that start at 0db), do they need to have their scale set to -6db before multiplying?
You said the scale should be set the same for the diffraction curve and datasheet curve....so I'm unclear.
Thanks.
If it's an asymmetric XO then having what appears to be different crossover frequencies makes sense. The slope on the driver with a single element pass is shallow compared to the driver with the two element pass; it is the combination that counts.By my calculations the high pass for the mid is around 5 kHz and the tweeter is 7kHz so I must be getting something wrong. for the online calculators, do you use nominal impedance of 8 Ohms, or something from the impedance chart, or the DC resistance?
Trace out the individual response of each driver and see if they meet at a -6dB point
- Home
- Loudspeakers
- Multi-Way
- Interdyn and SEAS drivers and crossover combination