I normally replace the supplies by a DC source with an AC component. Then looking at the output gives you a direct result of the PSRR.
Jan
Thanks, it makes thing simpler, and faster bacause with a open loop class d, I need psrr solution, and this is possible as I did read, with feed forward or hysteresis boundary.
Everything fine with your sister?.
regards
Attachments
Last edited:
That thread sounds like a Blowtorch thread for simulators 😡
Jan
There does not seem to be a similar accommodation for inductor loops.
Sorry Scott, I don't follow...
Jan
The simulator stops and makes you add small series R's (or other remedy). The inverse of the problem fixed by huge resistors across caps. In either case I don't need any reason to leave sloppy constructs on my schematic.
Last edited:
in the inductor settings popup the very bottom reads: "Series resistance defaults to 1 mOhm"
under tools>control panel>hacks! you can clear the 1 mOhm default, set the L Rser = 0
under tools>control panel>hacks! you can clear the 1 mOhm default, set the L Rser = 0
I have a question about the distortion plot, what means the number between the brackets? I do see 0.05 and 1.0 procent, is maybe that number imd distortion?.
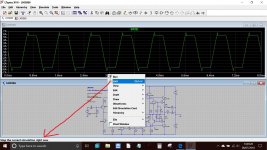
Normal with a fase shift flying capacitor class d amp carrier get doubled, but in ltspice I can not see that.
Thanks for the help.
regards
Normal with a fase shift flying capacitor class d amp carrier get doubled, but in ltspice I can not see that.
Thanks for the help.
regards
Attachments
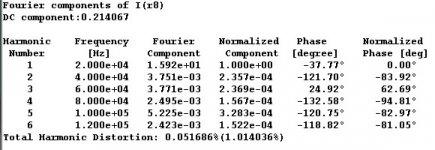
The number between parentheses is the value coming from all harmonics. The other, lower, is the total from the harmonics shown in the list
in the inductor settings popup the very bottom reads: "Series resistance defaults to 1 mOhm"
under tools>control panel>hacks! you can clear the 1 mOhm default, set the L Rser = 0
The box was not checked in my case and it still wouldn't work because the L's are part of a transformer (the message disappears when the coupling statement is present).
I have a question about the distortion plot, what means the number between the brackets? I do see 0.05 and 1.0 procent, is maybe that number imd distortion?.
Normal with a fase shift flying capacitor class d amp carrier get doubled, but in ltspice I can not see that.
Thanks for the help.
regards
Post #8 here:
What's LTspice doing there?
The number between parentheses is the value coming from all harmonics. The other, lower, is the total from the harmonics shown in the list
Thanks for explaning for me.
kees
Does anybody out there have a model for medium power depletion mode
MOSFETs? I'd like to use them for bootstrapping / cascoding.
There aren't many types available, and even less simulation models.
There is a p-spice model for the Infineon BSP149. That seems
quite complex and I would not trust it even if I was able to force-feed
it to LTspice.
Examples:
IFX BSP149, BSS159
IXYS CPC3703CTR , CPC3902ZTR
Microchip DN2470K4-G , DN3525N8-G
regards, Gerhard
Automating plotting THD vs power
I'm plotting 1kHz THD vs power for open loop and various feedback configurations and levels for a tube amp.
It's a very tedious process:
- Use multiple runs to plot peak-to-peak input voltage vs power out and add this data to a spreadsheet
- Run the sim for each of those peak-to-peak input voltages and use a .four directive to generate the THD. After each run add the THD data to a spreadsheet.
- Plot the results.
You have to decide what accuracy you want in order to set the delay cycles and the number of cycles over which to take the THD measurement.
I'm using a delay of 10 cycles and measurement over 10 cycles. More would be nicer but running the simulation below takes a very long time.
What I've managed to do so far is make the input voltage a variable using
SINE(0 {Vin} {F} 0 0 0 1000)
Then I've added the input voltages worked out in the first step as a step parameter list:
.step param Vin list 0.03 0.065 0.092 0.13 0.205 0.29 0.4515 0.567 0.63 0.659 0.6875 0.74 0.766 0.795 0.85
When I display the error log and I can copy the THD for each step. I also get a very pretty but not particularly useful chart of output power:

Ctrl-clicking on V(LOAD)*I(R21) results in ".step'ed data sets cant be integrated". Not unreasonable.
Can anyone suggest ways I can better automate this process please?
Ideally LTSpice would generate the plots for me but I haven't worked out how to do that.
Even getting LTSpice to put the average power into the error log for each step would be nice.
Thanks!
I'm plotting 1kHz THD vs power for open loop and various feedback configurations and levels for a tube amp.
It's a very tedious process:
- Use multiple runs to plot peak-to-peak input voltage vs power out and add this data to a spreadsheet
- Run the sim for each of those peak-to-peak input voltages and use a .four directive to generate the THD. After each run add the THD data to a spreadsheet.
- Plot the results.
You have to decide what accuracy you want in order to set the delay cycles and the number of cycles over which to take the THD measurement.
I'm using a delay of 10 cycles and measurement over 10 cycles. More would be nicer but running the simulation below takes a very long time.
What I've managed to do so far is make the input voltage a variable using
SINE(0 {Vin} {F} 0 0 0 1000)
Then I've added the input voltages worked out in the first step as a step parameter list:
.step param Vin list 0.03 0.065 0.092 0.13 0.205 0.29 0.4515 0.567 0.63 0.659 0.6875 0.74 0.766 0.795 0.85
When I display the error log and I can copy the THD for each step. I also get a very pretty but not particularly useful chart of output power:
Ctrl-clicking on V(LOAD)*I(R21) results in ".step'ed data sets cant be integrated". Not unreasonable.
Can anyone suggest ways I can better automate this process please?
Ideally LTSpice would generate the plots for me but I haven't worked out how to do that.
Even getting LTSpice to put the average power into the error log for each step would be nice.
Thanks!
If ltspice is reading from disk and I want to stop it with esc, because it is very slow,and after some simulation time this happens, it do not stop, it just go on with reading.
very anoying.
greetz kees
very anoying.
greetz kees
If a sim is running slow or having trouble converging then right click the circuit and select 'Halt' (or press CTRL and H).
Also you can click the Halt button on the toolbar.
Automating plotting amp THD vs power
I've been doing a lot of research on this.
Using the stepping and measure commands I've managed to automate some of it.
.step causes an analysis to be repeatedly performed while stepping the temperature, a model parameter, a global parameter, or an independent source. Steps may be linear, logarithmic, or specified as a list of values.
I use a small number of cycles to work out a list of input voltages that will roughly produce the output powers that I'm interested in (100mW, 500mW, !w, 2W etc).
Then I make the AC signal source amplitude {Vin} and use something like this to perform the analysis using a much large number of cycles:
.step param Vin list 0.0189 0.04225 0.05975 0.0843 0.133 0.1865 0.288 0.3565 0.3935 0.4103 0.427 0.4585 0.475 0.4425 0.535
I use the usual .four commands to get the THDs I'm interested in added to the log and then some .meas commands to get gains and output powers added to the log like this:
.meas Vin RMS V(n015)
.meas Vout RMS V(LOAD)
.meas gain param Vout/Vin
.meas TRAN Vload_rms RMS V(LOAD)
.meas TRAN Iload_rms RMS I(R21)
.meas rms_power PARAM Vload_rms*Iload_rms
When I start investigating I'm always amazed what LTSpice can do!
Next step is to investigate how I can get LTSpice to create the plots I want for me. I did find Audio Total Harmonic Distortion Analyzer for LTSPICE, making THD vs. Amplitude and Frequency sweeps in LTSPICE. Good place to start but I want THD vs Power.
I'm plotting 1kHz THD vs power for open loop and various feedback configurations and levels for a tube amp.
It's a very tedious process:
- Use multiple runs to plot peak-to-peak input voltage vs power out and add this data to a spreadsheet
- Run the sim for each of those peak-to-peak input voltages and use a .four directive to generate the THD. After each run add the THD data to a spreadsheet.
- Plot the results.
I've been doing a lot of research on this.
Using the stepping and measure commands I've managed to automate some of it.
.step causes an analysis to be repeatedly performed while stepping the temperature, a model parameter, a global parameter, or an independent source. Steps may be linear, logarithmic, or specified as a list of values.
I use a small number of cycles to work out a list of input voltages that will roughly produce the output powers that I'm interested in (100mW, 500mW, !w, 2W etc).
Then I make the AC signal source amplitude {Vin} and use something like this to perform the analysis using a much large number of cycles:
.step param Vin list 0.0189 0.04225 0.05975 0.0843 0.133 0.1865 0.288 0.3565 0.3935 0.4103 0.427 0.4585 0.475 0.4425 0.535
I use the usual .four commands to get the THDs I'm interested in added to the log and then some .meas commands to get gains and output powers added to the log like this:
.meas Vin RMS V(n015)
.meas Vout RMS V(LOAD)
.meas gain param Vout/Vin
.meas TRAN Vload_rms RMS V(LOAD)
.meas TRAN Iload_rms RMS I(R21)
.meas rms_power PARAM Vload_rms*Iload_rms
When I start investigating I'm always amazed what LTSpice can do!
Next step is to investigate how I can get LTSpice to create the plots I want for me. I did find Audio Total Harmonic Distortion Analyzer for LTSPICE, making THD vs. Amplitude and Frequency sweeps in LTSPICE. Good place to start but I want THD vs Power.
Last edited:
Measuring over 10 cycles is not a lot to get accurate results, 20 would be better, but I understand that simulation time is a problem.I'm plotting 1kHz THD vs power for open loop and various feedback configurations and levels for a tube amp.
I'm using a delay of 10 cycles and measurement over 10 cycles. More would be nicer but running the simulation below takes a very long time.
Therefore my question: what is the Maximum Timestep that you have specified in the Transient command.
Taking a very small step size, increases simulation time a lot.
Because you are just interested in harmonics of a 1Khz signal, a FFT Spectrum width of 25.600Hz (= 2^9 datapoints) seems adequate with a filter width of 100Hz.
For that you could then use a Maximum Timestep of 19.5usec for the 10 msec Stop Time that you are using.
When using a Stop Time of 20msec for 20 cycles, you will need 2^10 datapoints for the same spectrum width of 25.600Hz, and use the same 19.5usec Maximum Timestep.
Hans
- Home
- Design & Build
- Software Tools
- Installing and using LTspice IV (now including LTXVII), From beginner to advanced