@tktran303
The dynamic mic shows about the same 5dB difference at 100Hz in THD at diffrent distances as the Earthworks!
Getting graphs looking the same with the same colours, resolution and legend often takes more time as the measurements themself ... but it's crucial to get comparable results! And you see if someone knows what he is doing ;-)

Happy to read this, some other people from certain magazine(s) don't seem to understand this step.but it's crucial to get comparable results!
Back in the day our reports would get a big fat cross mark through it and you had to do it all over again.
Having different graphs is extremely deceiving.
I agree with you both. It's also challenging getting the right balance of number of graphs, text and interpretation. For many of us on this forum, who are measuring for the 0th time, or the 999th time I also need to strike a balance of making it readable, without being too repetitive, or being too didactic. And in the meantime, I'm cognizant that things like this are proceeding.
All commentary so far appreciated. I take it all as -how-can-it-be-done-better, or how-can-it-be-done-slightly-less worse 😊
I am awaiting commentary by @jasdiy - feedback in regards to how graphical design variables that may bias the interpretation of the data presented in the graph.
1. On my workstation I am running 4K on Windows 11, on my laptop I'm running 1080p Windows 10, and REW exhibits slightly different visuals. That is bad.
2. Screen captures look slightly different. So despite the data capture being saved on the local network in REW raw data (.mdat) when opening the data on another system, or doing a screen capture, it can look different.
This is very bad.
Now back to the Sennheiser MD42. We can see that it too, when observes a signal at varying distances, also records different amounts of 2nd harmonic. Thus we can say it's own self-distortion is evident.
However, the Sennheiser MD42 records ~10dB less H2 (-64 to -70dB H2 @100Hz) compared to the Earthworks M23 (-53dB to -63dB) above about ~90Hz. Furthermore, it is capable of recording a full 15-20dB lower H2 (-70dB to -80 H2) from 150Hz upwards (M23 observes -55 to -60dB in that range)
However, below 100Hz, the difference between observed H2 appears to reduce. Here the H2 is lower by:
It is not clear to me (yet) why this difference exists. But certainly the phenomenon IS interesting.
All commentary so far appreciated. I take it all as -how-can-it-be-done-better, or how-can-it-be-done-slightly-less worse 😊
I am awaiting commentary by @jasdiy - feedback in regards to how graphical design variables that may bias the interpretation of the data presented in the graph.
1. On my workstation I am running 4K on Windows 11, on my laptop I'm running 1080p Windows 10, and REW exhibits slightly different visuals. That is bad.
2. Screen captures look slightly different. So despite the data capture being saved on the local network in REW raw data (.mdat) when opening the data on another system, or doing a screen capture, it can look different.
This is very bad.
Now back to the Sennheiser MD42. We can see that it too, when observes a signal at varying distances, also records different amounts of 2nd harmonic. Thus we can say it's own self-distortion is evident.
However, the Sennheiser MD42 records ~10dB less H2 (-64 to -70dB H2 @100Hz) compared to the Earthworks M23 (-53dB to -63dB) above about ~90Hz. Furthermore, it is capable of recording a full 15-20dB lower H2 (-70dB to -80 H2) from 150Hz upwards (M23 observes -55 to -60dB in that range)
However, below 100Hz, the difference between observed H2 appears to reduce. Here the H2 is lower by:
| Frequency | |||||||||
20 | 30 | 40 | 50 | 60 | 70 | 80 | 90 | 100 | |
| MD42 compared to M23 | |||||||||
| Recorded H2 (dB) | -1 (ie. higher) | 2 | 3 | 5 | 6 | 6 | 8 | 10 | 11 |
It is not clear to me (yet) why this difference exists. But certainly the phenomenon IS interesting.
Last edited:
Coming up-
Line Audio Omni1
Microtech Gefell MK 202 and/or MK301 (TBC)
Brüel & Kjær 4133 (confirmed)
Thanks to those who advised/assisted/made this possible.
@HiFiCompass @bwaslo @IamJF
Line Audio Omni1
Microtech Gefell MK 202 and/or MK301 (TBC)
Brüel & Kjær 4133 (confirmed)
Thanks to those who advised/assisted/made this possible.
@HiFiCompass @bwaslo @IamJF
Since I have a Omni1 as well, it could be interesting to compare different setups.
I only don't a Purifi driver here.
I am open for donations 😁
Speaking of.
I invested in a laser displacement sensor.
Currently a bit busy with work, but when there is a bit more time, the goal is to actually create some more large signal measurements.
I only don't a Purifi driver here.
I am open for donations 😁
Speaking of.
I invested in a laser displacement sensor.
Currently a bit busy with work, but when there is a bit more time, the goal is to actually create some more large signal measurements.
However, the Sennheiser MD42 records ~10dB less H2 (-64 to -70dB H2 @100Hz) compared to the Earthworks M23 (-53dB to -63dB) above about ~90Hz.
However, below 100Hz, the difference between observed H2 appears to reduce. Here the H2 is lower by:
Frequency MD42 compared to M23 Recorded H2 (dB)
It is not clear to me (yet) why this difference exists. But certainly the phenomenon IS interesting.
A condenser mic (the Earthworks M23) responds "in phase" with the acoustical wave form, while a dynamic (moving coil) mic (the Sennheiser MD42) electrical response lags it by 90 degrees.
Lower frequencies have a longer time duration, so the phase lag would be twice as long at 50Hz as 100Hz.
Could the later arrival time at lower frequencies of the dynamic mic electrical output compared to the sampling rate be responsible for the relative difference in harmonic distortion with frequency?
Another observation and conflicting question:
Dynamic mics seem less sensitive (responsive?) to wind noise than condensers.
Drivers move progressively more air (wind) as the frequency is reduced for a given SPL level.
Would reduced sensitivity to wind reduce harmonic distortion level?
Art
@tktran303 the problem is very simple (as I see it 😉 ) - we measure something (hertz), Quantify it (262 hertz), then map this into another dimension (length, colour, angle). We assume that their is a liner mapping between our Quantities of interest (hertz) and what we 'see' perceive. There is not. So in the case of tweeter dispersion maps consider mono chromatic 'color maps' not rainbow.
Plots are a language system - if your fluent great - if not then you just have to do the hard work of translation or learning the language. I do wish it was easier🙁.
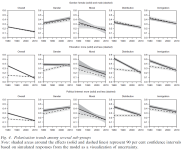
As for the number of plots I feel the same as others 'far to many' ... but I suspect the number is not the real problem (please see attachment). I suspect that the plots can NOT be readily compared creates our frustration. In tktran303 defence these multiple access figures can be very time consuming to set up and it would be unreasonable of us to expect anything else.
Cheers Jasdiy
Plots are a language system - if your fluent great - if not then you just have to do the hard work of translation or learning the language. I do wish it was easier🙁.
As for the number of plots I feel the same as others 'far to many' ... but I suspect the number is not the real problem (please see attachment). I suspect that the plots can NOT be readily compared creates our frustration. In tktran303 defence these multiple access figures can be very time consuming to set up and it would be unreasonable of us to expect anything else.
Cheers Jasdiy
Attachments
I see. Those damn cones!!
Comparing the plots between different microphones would be something I will work on, once all the microphone have arrived.
I’ll have think and look at how REW can be monochromaticised”
In the meantime, the Omni1:

Comparing the plots between different microphones would be something I will work on, once all the microphone have arrived.
I’ll have think and look at how REW can be monochromaticised”
In the meantime, the Omni1:
With a Farina style measurement? AFAIK phase shifts wouldn't matter, unless sweeping very fast. Something you shouldn’t do anyway.Could the later arrival time at lower frequencies of the dynamic mic electrical output compared to the sampling rate be responsible for the relative difference in harmonic distortion with frequency?
Why would you not measure close to the cone? To me it seems cone breakup mainly leads to linear distortion.Are you thinking "that nutter is trying to measure harmonics with a mic 1/2" to the cone... clearly it shouldn't be done! I mean, how many microphones is he going to try?"
I don't have much to add on this subject. I am content to learn. Clever idea to measure the same woofer at varying distances but constant voltage. The changes in distortion have to come from the instrumentation, not the woofer.Unusually quiet @hifijim
Any thoughts?
Do you have a theory or speculation on how low HD must be in order to become inaudible with music? .......... j.
No theory here, but from personal experience and looking at my and other's detection of distortion using various tests including theseDo you have a theory or speculation on how low HD must be in order to become inaudible with music?
https://www.klippel.de/listeningtest/
the audibility is dependent on the music source, frequency range, type of the distortion and individual listener.
Individuals audibility of distortion range from over 50% (harmonics only -6dB below fundamentals) to under 0.3%, harmonics -50dB below the fundamentals.
I was kind of in the middle on this test:
Using two tones, I did better than average, but some were down below 0.1% distortion:
With some music having over 100% distortion "built in", it may be difficult to detect in the speaker you listen to, or an exceptionally clean speaker may make it even more audible.
At any level, good to know how much a test mic contributes to the distortion, even if you can't hear it..
Art
Added measurements from the Omni1, to save space for a maximum of 20 images in the initial post, I've moved explanatory data here
Appendix:
Measurement imprecision
When we take a measurement indoors, we are prone to all kind of reflections, because sound can act like a wave. If you've ever taken a measurement of your speakers are your listening position, you may have noticed how the frequency response looks nothing like the straight lines from the manufacturer's data. As a countermeasure, we measure at a closer distance, and "block" all those reflections from affecting our measurement. One way to do this is to use a "gate"- to stop the reflections from being interpreted.
With a "gate" of 7 milliseconds, we can block the first echo, which is usually the floor (or ceiling) from affecting our measurement. Perfect right? Well, not so fast. Since we've used a gate of 7ms, the measurement precision is limited to about 150Hz. (142Hz to be exact, since frequency = 1/Time period; T being 0.007 seconds)
This means that EVERYTHING below 142Hz is invalid.
In the octave between, 2-4 KHz, which spans 2000Hz, our resolution is 142 / 2000 = ~1/14th of an octave. Between 500Hz and 2000 Hz, which is 2 octaves and having a numerical span of 1500Hz, we have a measurement resolution of 142/1500= ~1/10 over 2 octaves. And between 142- 425Hz, we're stuck with 1/3 octave resolution. So even though the curve looks nice and smooth on the left side of the graph, there is less accuracy in those lower frequencies.
Let's go back to look at the original graph:

What's the immediate consequence of this? The measurement below 600Hz is affected by room reflections.
(NB. To get a complete frequency response measurement, one option is to merge or blend the two parts together. First we, take near field measurements, a technique just 50 years new, by Don B. Keele . In short, we move the microphone up again the cone and take measurements. This way we know what the woofer or port is doing. This method largely ignores what the room is doing. Later, we can even apply some correction factors later to see what it might look like at 1m, or 3m, or 10m, and then blend the low frequency and high frequency measurements together. Here the late Jeff Bagby explains his near and far field blending process)
We must have strategies to measure, even if we had a Klippel Near Field Scanner or anechoic chamber. This is what Wolfgang Klippel does need to take a measurement in his office, which doesn't have space for his Near Field Scanner. He uses a big table for a ground plane measurement of a small consumer speaker:

Reference: Acoustical Measurement of Sound System Equipment according IEC 60268-21, Session #4: Simulated standard condition at an evaluation point, slide 8.
So one method is to measure the high frequencies in the "far field", and the low frequencies in the "nearfield". Please note that this term is NOT the same as the same term as that used in pro-audio use eg. nearfield OR midfield monitors
Appendix:
Measurement imprecision
When we take a measurement indoors, we are prone to all kind of reflections, because sound can act like a wave. If you've ever taken a measurement of your speakers are your listening position, you may have noticed how the frequency response looks nothing like the straight lines from the manufacturer's data. As a countermeasure, we measure at a closer distance, and "block" all those reflections from affecting our measurement. One way to do this is to use a "gate"- to stop the reflections from being interpreted.
With a "gate" of 7 milliseconds, we can block the first echo, which is usually the floor (or ceiling) from affecting our measurement. Perfect right? Well, not so fast. Since we've used a gate of 7ms, the measurement precision is limited to about 150Hz. (142Hz to be exact, since frequency = 1/Time period; T being 0.007 seconds)
This means that EVERYTHING below 142Hz is invalid.
In the octave between, 2-4 KHz, which spans 2000Hz, our resolution is 142 / 2000 = ~1/14th of an octave. Between 500Hz and 2000 Hz, which is 2 octaves and having a numerical span of 1500Hz, we have a measurement resolution of 142/1500= ~1/10 over 2 octaves. And between 142- 425Hz, we're stuck with 1/3 octave resolution. So even though the curve looks nice and smooth on the left side of the graph, there is less accuracy in those lower frequencies.
Let's go back to look at the original graph:
What's the immediate consequence of this? The measurement below 600Hz is affected by room reflections.
(NB. To get a complete frequency response measurement, one option is to merge or blend the two parts together. First we, take near field measurements, a technique just 50 years new, by Don B. Keele . In short, we move the microphone up again the cone and take measurements. This way we know what the woofer or port is doing. This method largely ignores what the room is doing. Later, we can even apply some correction factors later to see what it might look like at 1m, or 3m, or 10m, and then blend the low frequency and high frequency measurements together. Here the late Jeff Bagby explains his near and far field blending process)
We must have strategies to measure, even if we had a Klippel Near Field Scanner or anechoic chamber. This is what Wolfgang Klippel does need to take a measurement in his office, which doesn't have space for his Near Field Scanner. He uses a big table for a ground plane measurement of a small consumer speaker:
Reference: Acoustical Measurement of Sound System Equipment according IEC 60268-21, Session #4: Simulated standard condition at an evaluation point, slide 8.
So one method is to measure the high frequencies in the "far field", and the low frequencies in the "nearfield". Please note that this term is NOT the same as the same term as that used in pro-audio use eg. nearfield OR midfield monitors
Last edited:
Just a small thing, but that yellow is REALLY hard to read in graphs 🙁
Could you maybe use colors that have more contrast?
I doubt that people with bad eye sight are even able to really read it.
Even more so with overly saturated display monitors.
Could you maybe use colors that have more contrast?
I doubt that people with bad eye sight are even able to really read it.
Even more so with overly saturated display monitors.
yes, I think that's the best idea in general 🙂 👍So one method is to measure the high frequencies in the "far field", and the low frequencies in the "nearfield".
From time to time, I lose confidence in my ability to merge a near field response with the gated far field polar responses... So I drag everything out side and do a ground plane measurement with resolution down to 30 Hz. ... And then I am reminded once again that the NF-merge process is quite accurate and precise. It is within the measurement uncertainty of my microphone for sure.
@tktran303
I think you have been doing incredible work so far! 🙂
A request from me, but I don't know how much work that is, is to find the limits of each microphone model.
The way it's written now just assumes that we can basically just add "the difference" between reference and DUT.
But it's a bit hard to see if scales that way nicely?
Because often it's not such a big deal if there are limitations to the equipment we use.
As long as those limitations are well defined.
For example, knowing the absolute distortion is one thing.
Having practical numbers for making a crossover is something else.
Also, maybe I didn't read it well myself, but do you have an indication of the noise floor as well as the loop-distortion of your setup without the microphone(s)?
- Home
- Design & Build
- Equipment & Tools
- In search of low distortion omnidirectional microphones for DIYers