Yep, especially at the end.
Here is the funny looking elephant eared looking thing on my
regular (challenging) HP339a analyzer:
Here is the funny looking elephant eared looking thing on my
regular (challenging) HP339a analyzer:
Prior to that I wanted to see how the nearly new analyzer
compared to the challenging analyzer.
These next two plots are for comparison.
Green is "new" analyzer,
Yellow is "challenging" analyzer
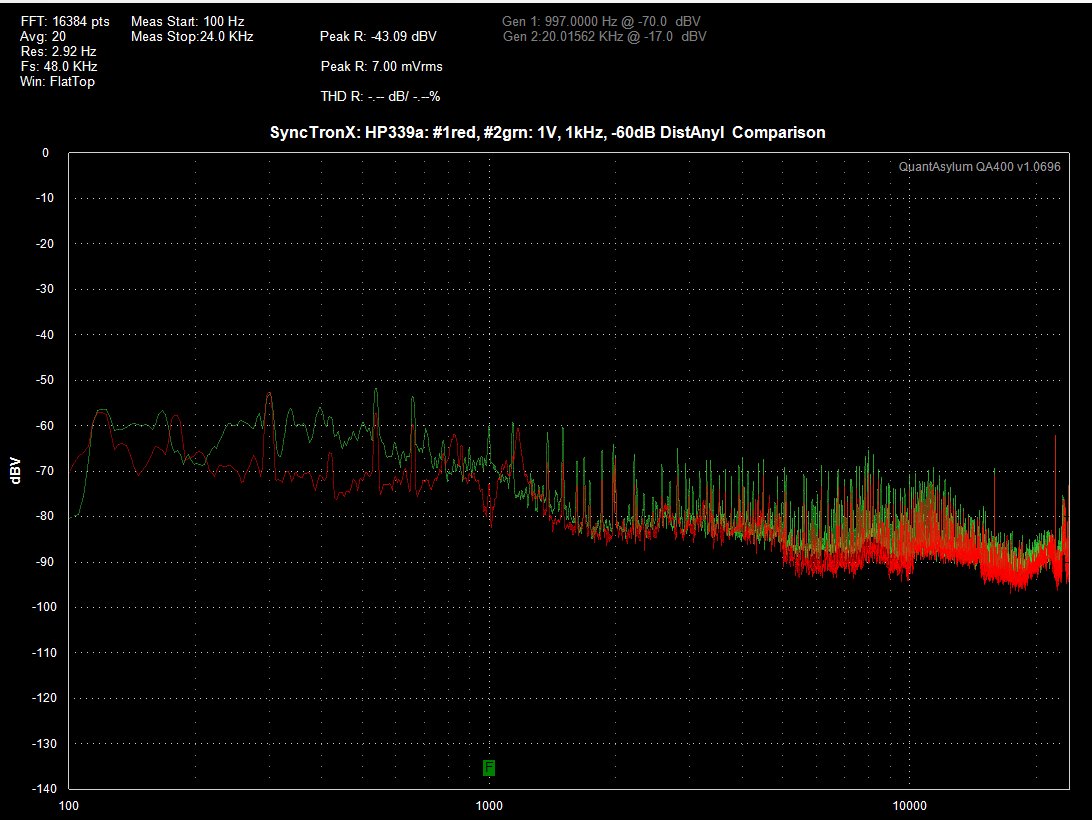
Here is a slightly different version.
Red is the Challenged Hp339a--look for the elephant ears.
Green is the "new" HP339a--it was DOA for probably 25 years.
compared to the challenging analyzer.
These next two plots are for comparison.
Green is "new" analyzer,
Yellow is "challenging" analyzer
Here is a slightly different version.
Red is the Challenged Hp339a--look for the elephant ears.
Green is the "new" HP339a--it was DOA for probably 25 years.
In the first plot, why is the 1kHz signal at -40dBV? It should be at 0dBV with 1VRMS out from the oscillator.
Plot on Post #481
RichEEM,
That is what the signal looks like
when I measure distortion of the oscillator output
into the HP339a's own analyzer with that deep null.
I can't explain what those two artifacts are?
Harmonics?
Elephant ears for lack of a better term.
I don't recall if it is "in range" that the
level LEDs are off.
I can double check and confirm.
The two artifacts look like level modulation. Measure the frequency offset from the fundamental to the artifact. I'll best it is either 60Hz or 120Hz. This will tell you exactly what it is.
What David said -- you need a working 400Hz HP filter to dump the modulation by the power line harmonics.
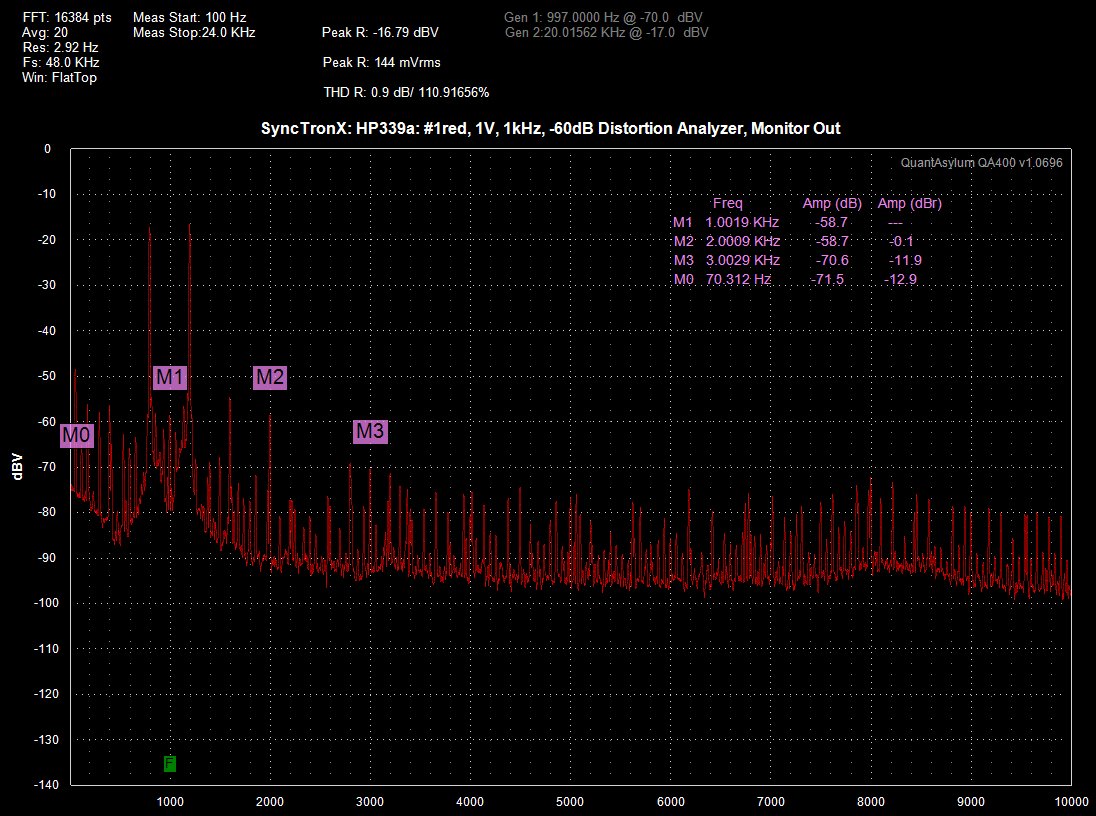
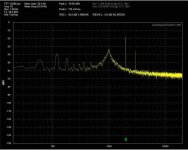
Plots with Measurements
This is what is happening as the distortion meter of the
HP339a is out of range on it's meter indication of greater than -20dB
at a Distortion Range of -40dB.
Then changing the Distortion Range to -50 so I get a -2 dB indication on the
Meter the wings appear.
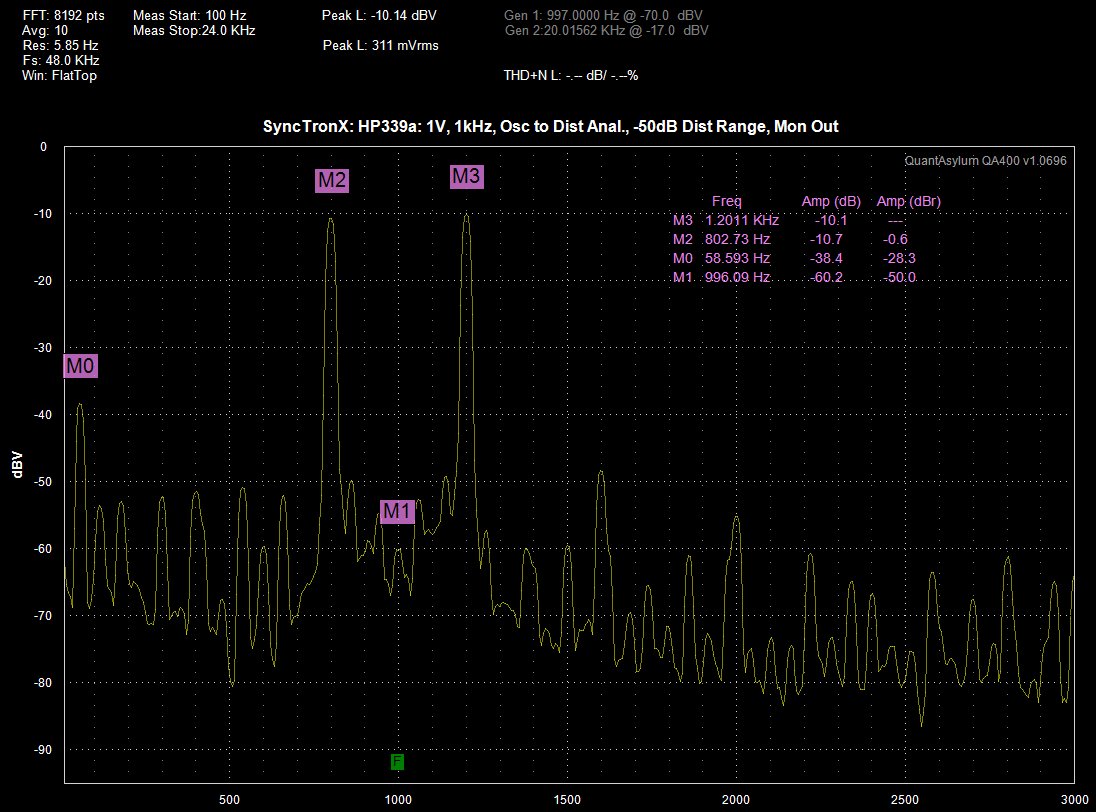
M1 - Fundimental about 996 Hz
M2 - First Wing about 802 Hz delta from 1 = 194 Hz
M3 - Second wing at 1,211 Hz delta from 1 = 215 Hz
combined span M2 + M3 = 409 Hz
802 Hz - 409 Hz = about 393 Hz.
M0 is at 58.6 Hz.
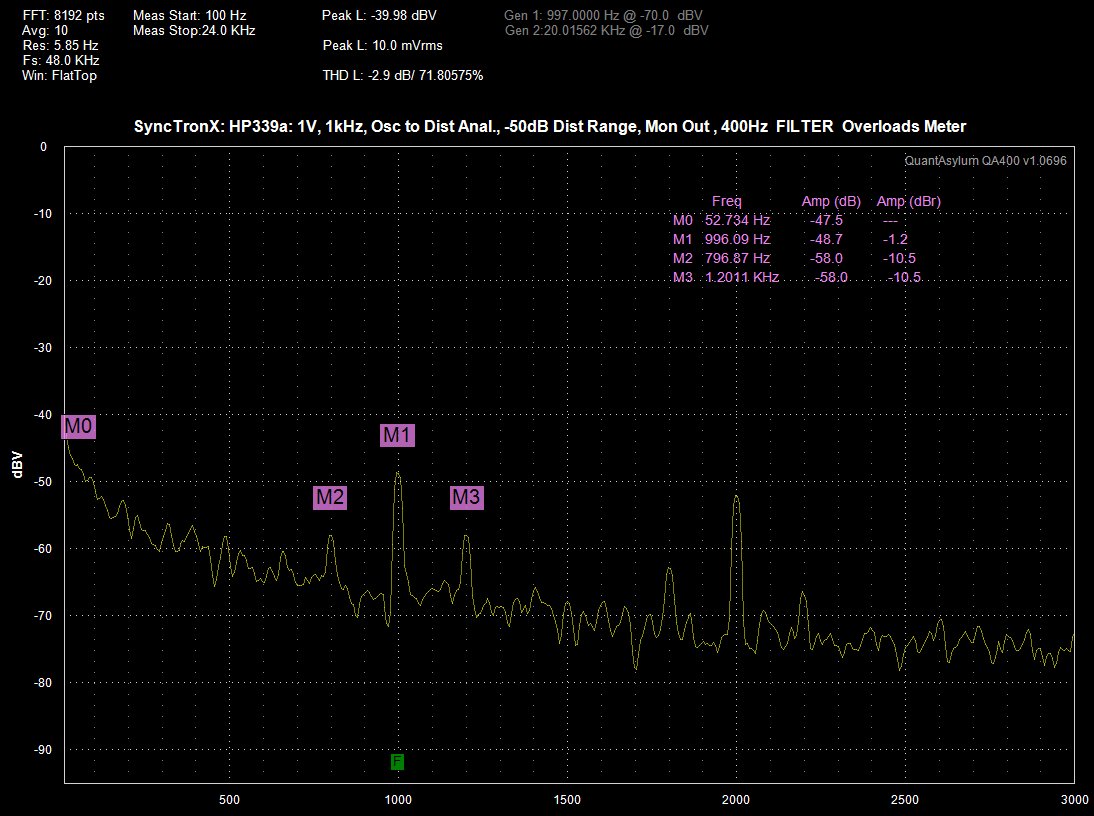
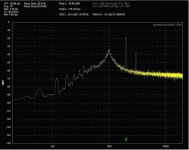
Here is another funny thing, the 400Hz filter still works
but puts that 11V dc on the meter which I've described before.
Here is the plot with the 400Hz filter:
This is what is happening as the distortion meter of the
HP339a is out of range on it's meter indication of greater than -20dB
at a Distortion Range of -40dB.
Then changing the Distortion Range to -50 so I get a -2 dB indication on the
Meter the wings appear.
M1 - Fundimental about 996 Hz
M2 - First Wing about 802 Hz delta from 1 = 194 Hz
M3 - Second wing at 1,211 Hz delta from 1 = 215 Hz
combined span M2 + M3 = 409 Hz
802 Hz - 409 Hz = about 393 Hz.
M0 is at 58.6 Hz.
Here is another funny thing, the 400Hz filter still works
but puts that 11V dc on the meter which I've described before.
Here is the plot with the 400Hz filter:
OK, good on the 400Hz filter working (kinda) despite the DC overload. Fix that -- you can see in the plots why it matters. You also need to use higher resolution of the spectrum, say at least 32k points, in order to resolve the 60/120Hz crud more clearly. When the bins are wide, with 8k points, a bunch of stuff gets included and throws the frequency accuracy off.
I see what may be frequency modulation of the oscillator. It does not take much to pull it a little. Supply ripple around the AGC circuitry would make for great fun. The 200 Hz is odd. 120 Hz or 180 Hz would make sense.
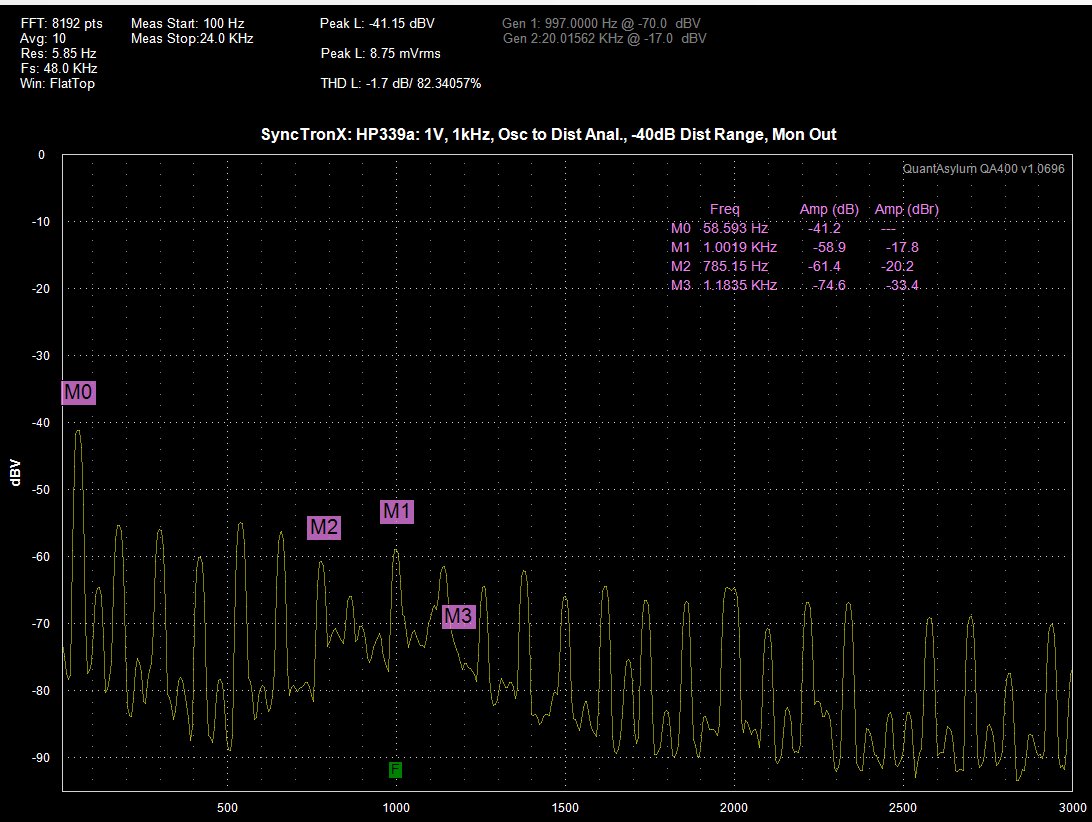
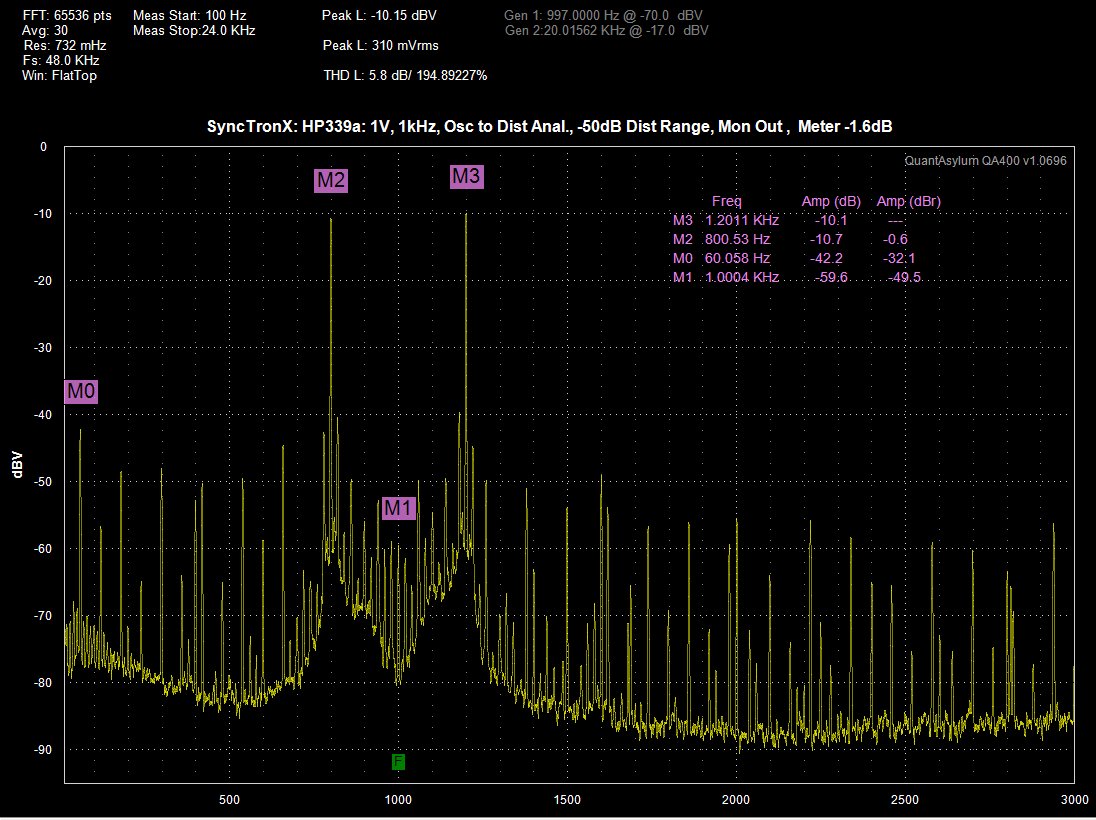
Update, haven't done the number yet:
200 Hz offset from 1kHz. 400 Hz total.
On lower Distortion, -40 there it looks like
60 Hz and 120 Hz cropping up on the level.
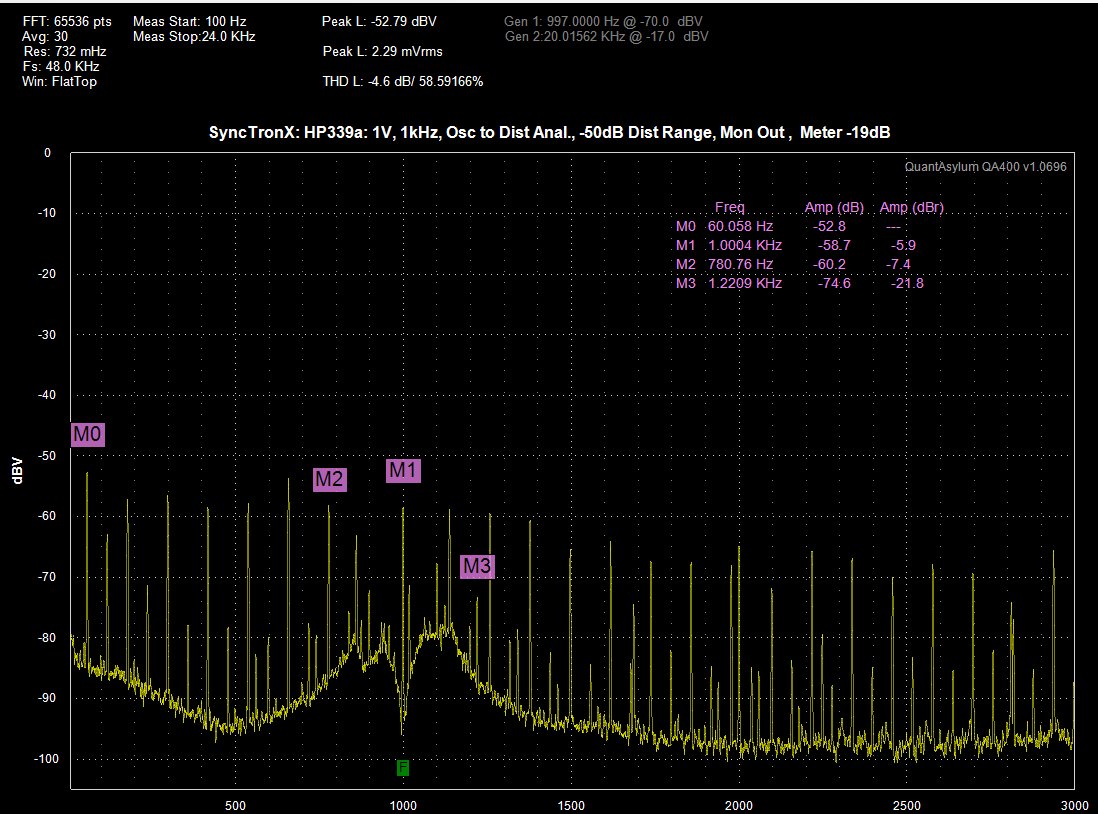
Here is higher res. Working on a higher resolution
of the pre elephant ears. The Frequency shifts about 20 Hz
at lower distortion range.
200 Hz offset from 1kHz. 400 Hz total.
On lower Distortion, -40 there it looks like
60 Hz and 120 Hz cropping up on the level.
Here is higher res. Working on a higher resolution
of the pre elephant ears. The Frequency shifts about 20 Hz
at lower distortion range.
Last edited:
OK, there's a lot of line frequency stuff there, but the "elephant ears" are something else. there is modulation going on, but hard to say what the actual modulating frequency is....
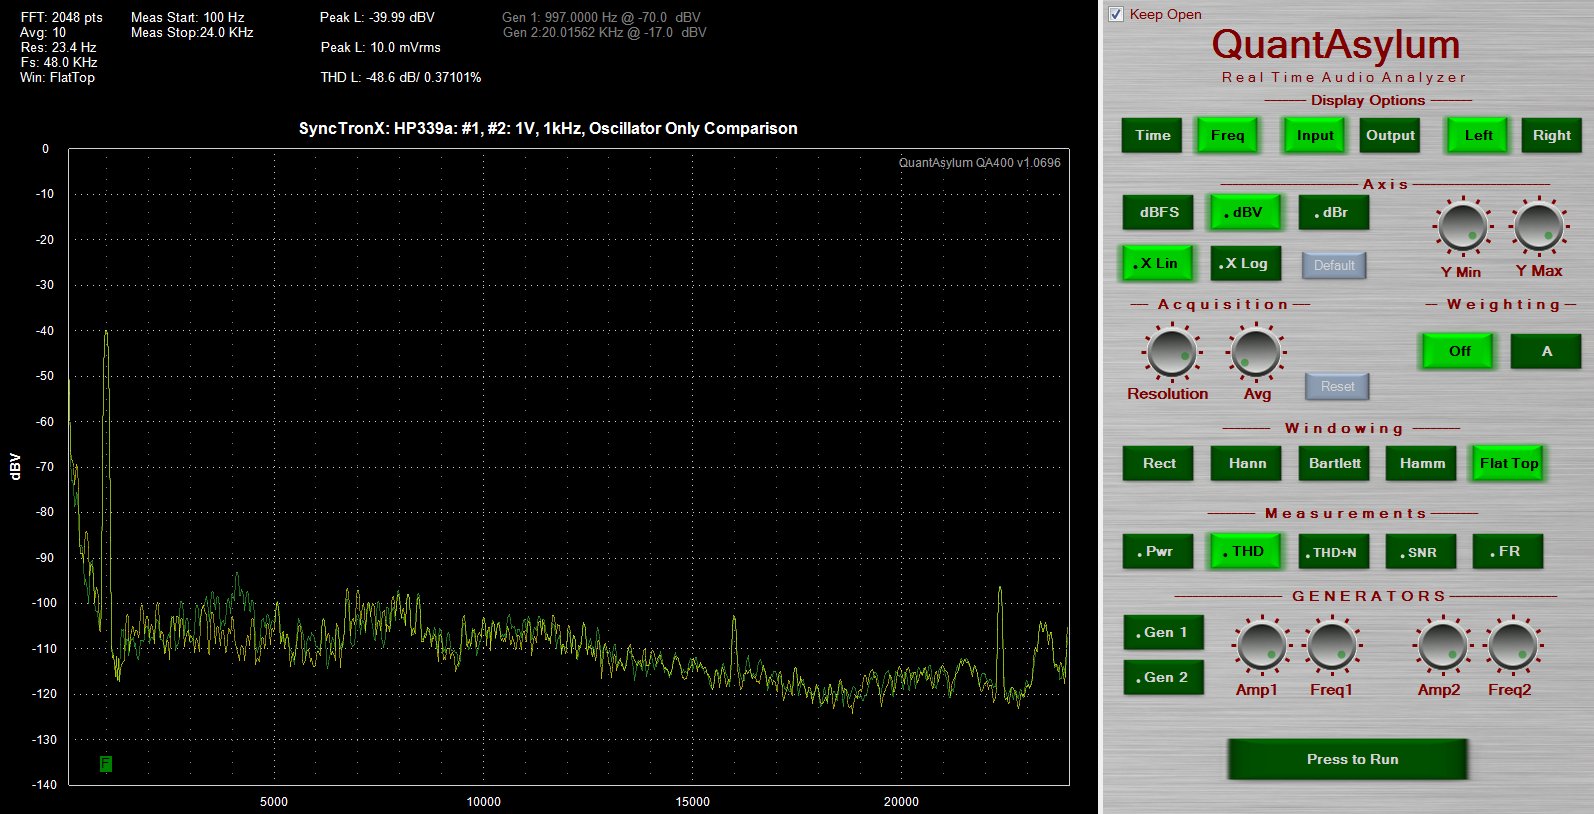
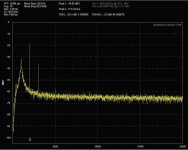
OK, Sync, these plots with a QA400 are from my 339. The 339 osc out to the analyzer in is 1kHz at 1VRMS. The 0dB line on each plot is -80dBV. The monitor out goes to the L in of the QA400. The window is flat top. The ground switch is in the right hand, floating position to reduce ground loop noise. In the center position, the ground noise is awful -- the QA400 and the computer share a ground, so the analyzer has to float.
The first plot is without the 400Hz HP filter, the second is with -- really makes a diff. The third is a linear plot for comparison to your plots -- ignore the title of the plot, it should say lin, not log -- it's late.
I haven't cal'd this unit in more than three years. It is almost always on, except when I'm on vacation. Nothing in the analyzer section has been modded, it's all original.
These should give you a baseline to use in evaluating your 339s.
Attachments
This is what is happening as the distortion meter of the
HP339a is out of range on it's meter indication of greater than -20dB
at a Distortion Range of -40dB.
Then changing the Distortion Range to -50 so I get a -2 dB indication on the
Meter the wings appear.
M1 - Fundimental about 996 Hz
M2 - First Wing about 802 Hz delta from 1 = 194 Hz
M3 - Second wing at 1,211 Hz delta from 1 = 215 Hz
combined span M2 + M3 = 409 Hz
802 Hz - 409 Hz = about 393 Hz.
M0 is at 58.6 Hz.
Here is another funny thing, the 400Hz filter still works
but puts that 11V dc on the meter which I've described before.
Here is the plot with the 400Hz filter:
OK it's not what I thought. Notice the disturbance is repeated on the harmonics.
This can be either be AM or as Demian pointed out FM or PM. It can be originating in the oscillator or the A4 board. try a different oscillator and see if it's still there.
Same problem with a different oscillator.
Using #2 oscillator to problem HP339a,
into the Distortion Analyzer.
When the meter reads correctly
and the Distortion Ranger and Input Range
are correct, I get the wings.
Wondering if I put the A4U1 board
cap across the wrong resistor, placed it
across R2 the 200K resistor.
I noticed the wings when adjusting the set points
from the board, Null & Frequency Adjustment.
Here is what I understand how to do notch, cals and phase:
External Source, 1V, 1kHz into Distortion Analyzer.
HP339a under test. knob settings:
Oscillator Level - OFF
Frequency Vernier 1kHz (should have no effect.
Frequency knobs (1 x 1K)
Meter Knobs:
Input Range = 1 V
Distortion Range = 0
Input/GND Select = DIS AN float (30V Max)
Filters = OUT
Meter Response = Norm
Function = Distortion Analyzer
1. Set FFT to A3 TP3
a. Set input 1V 1kHz on A3 TP4 (reading from this test point?)
or place signal on A3 TP4.
b. Calibrate Notch (for lowest notch level in -dB)
c. Calibrate Phase (not sure how to do phase?)
2. Connect FFT to A4 TP1
a. adjust InputBalance for min hash and harmonic(dbV & THD from QA400?)
b. repeat Step 1 (Step 1, 1a, 1b, 1c?)
3. Connect to TP3. Not sure what to do next.
I couldn't find this proceedure in the manual.
Doesn't mean it isn't there but didn't find it.
manual has the outputs at the MONITOR
for me, that is problematic.
Clarification would be appreciated.
Note: my set point on the A3TP4 reading is different
on the DUT HP339a. 1V, 1kHz into distortion analyzer
results in a A3TP4 reading of 3.174V AC on my Meter.
or roughly the manual's set point of 3.162 +- .04 for Meter,
LED, AUTO LEVEL etc.
Last edited:
Sync, you're going to have to start at the beginning with this unit and go stage by stage from the input on, with a good scope, accurate meter, and known good signal source, to find where the problems are,, and fix them in order -- only then can anything useful be accomplished. You can obviously separate the oscillator from the analyzer, unless the power supplies are a big factor in the problems.
The manual's cal procedure follows this route and I know it works -- the crucial thing is using the scope to verify that signals at any point are as expected and not full of HF oscillations or other noise, which the meter won't tell you. You can usually use a 1X probe (1Mohm Z) on the test points without causing problems -- if you want to be safe, and you have a sensitive scope, then use a 10X probe.
The manual's cal procedure follows this route and I know it works -- the crucial thing is using the scope to verify that signals at any point are as expected and not full of HF oscillations or other noise, which the meter won't tell you. You can usually use a 1X probe (1Mohm Z) on the test points without causing problems -- if you want to be safe, and you have a sensitive scope, then use a 10X probe.
Last edited:
RichEEM,
I agree. It was during the Cal procedure that I noticed the elephant ears.
This was from identifying and tuning the voltages around
the meter, their pots, the 1/3 and Full Deflection of the meter.
It generally meets specs but there is still some kind of funny business
that I've not been able to diagnose.
From what I identified, those elephant ears are before the Meter and
it's output. It is there when I place the FFT on A3 TP3 and get the
meter working within range.
There are two areas that I have problems with
that is tweaking the subsystems and the more detailed offset
set points for setting the harmonics in the HP339a.
I"ll have to spend some more time on the review of
the manual.
Also I have to find the harmonics that Demian suggested I
try to identify too.
There are still issuses around the 400 Hz filter.
A1U2 quad opamp is screwy.
I'll start back and look at the power suppy with
the FFT QA400 and see what it looks like.
I can't see those harmonic distortions on the scope.
I can see when it is screwed up bad on the scope.
The other thing I need is for David to find out
what all he did to get his A4 board working with
the LT1468. I need to insure I have the right
cap in the right place. I undid most of the stuff
on that board but a couple of little things.
I'll plag board #2 into A4. That will isolate a problem
in the HP339a unit or on the A4 board.
First I'll check power supply rails then the pin 6 of
A1U1. Then go back to A1U2 Quad OpAmp look
at harmonics, and scope.
Hopefully I can work some more this weekend
and in between life.
Appreciate everyone's thoughts and input. : )
Sync, I think you need to be careful using the QA400, just because of the amazing amount of noise associated with its USB connection to the computer, and the related noise from the computer, as well as the grounding problems that can result; so poking in the innards of the 339 with the QA400 can be problematic.
Most of the checkout and cal procedure can be done with a scope and an AC meter. The QA400 is essential for three things: 1) tuning the null, where the QA is connected to the monitor output. 2) for adjusting the oscillator for lowest distortion.
3) for checking on the results of mods to the circuitry of the 339.
Same problem with a different oscillator.
Using #2 oscillator to problem HP339a,
into the Distortion Analyzer.
When the meter reads correctly
and the Distortion Ranger and Input Range
are correct, I get the wings.
Wondering if I put the A4U1 board
cap across the wrong resistor, placed it
across R2 the 200K resistor.
I noticed the wings when adjusting the set points
from the board, Null & Frequency Adjustment.
The cap goes across the 200k resistor.
Probe A4U1 with a scope and see if there is any parasitic oscillation there.
- Home
- Design & Build
- Equipment & Tools
- HP339A distortion analyser