REW can modify the harmonic levels to push loopback display of harmonics down to (or below) noise floor level with a bit of 'tuning', which is fine for say a 1kHz tone, or when you aren't changing the frequency much.
@trobbins - Thanks for the tips!
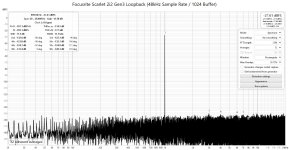
Here's a new loopback with tweaked settings. I seem to get the best results with a 48kHz sample rate and -15dBFS on the signal generator. This is with the 20Hz/20kHz bandwidth limit and coherent averaging enabled. The other settings are displayed on the plot.
PS - this is with my laptop plugged in.
Here's a new loopback with tweaked settings. I seem to get the best results with a 48kHz sample rate and -15dBFS on the signal generator. This is with the 20Hz/20kHz bandwidth limit and coherent averaging enabled. The other settings are displayed on the plot.
PS - this is with my laptop plugged in.
Attachments
I just saw this thread and reading through all 1853 posts seems hard to keep up…
I hope I could make a short question:
Is the Focusrite Scarlet Solo 3rd gen still a good USB inteface for these measurements?
My 2 cents: The Solo is fine for single channel measurements like amplifiers. However, for measuring loudspeakers you'd probably want the 2i2 so you could take advantage of dual channel measurements. The Solo limits you to single channel measurements.
Yes, well worth playing around with settings. Laptops are great as a way to minimise ground loops. Perhaps enable the 'Get fundamental from generator'. I think the REW help on coherent averaging advices using smaller FFT lengths, and exponential averaging may help a titch too.Here's a new loopback with tweaked settings. I seem to get the best results with a 48kHz sample rate and -15dBFS on the signal generator. This is with the 20Hz/20kHz bandwidth limit and coherent averaging enabled. The other settings are displayed on the plot.
Were you modifying the harmonics for that latest plot? It can be a bit time consuming to adjust amplitude and phase, but can be very pleasing 🙂
I tinkered with Signal dBFS level, Sample Rate, and FFT length to get the lowest distortion 1kHz plot. I also found that disabling "Get fundamental from generator" helped a bit. I didn't see a noticeable difference between 32 and exponential averaging.
I did read other posts of users with Focusrite Scarlets adjusting the line input gain. One post mentionws the 11 o'clock position for the input. Mine is all the way down around the 7 o'clock position. I found any increase on this (adding gain) made the plots significantly worse and usually resulting in clipping. Maybe someone else with a Focusrite can chime in here.
You can easily spend hours trying different things to see what works best with your setup.
Note sure what you mean by "Were you modifying the harmonics for that latest plot?".
Question on output levels: The specs for my device indicate the output is capable of +15.5 dBu. Doesn't that work out to 4.6Vrms? I attached a 3wire TRS connector and measured the voltage across the signal wires with my Amprobe AM-510 in AC mode. I only get 2.7V with the signal generator in REW at 0 dBFS. If I use a mono connector, I get 1.3V.
Not sure if there's something I need to adjust in REW or if I'm interpreting the specs incorrectly.

Not sure if there's something I need to adjust in REW or if I'm interpreting the specs incorrectly.
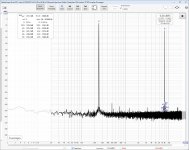
Is IMD testing possible using the soundcard as a generator? I tried doing a loopback for 250Hz & 8kHz and got an IMD of -66dB. Am I doing something wrong or is it not realistic with a setup like this? I searched this thread but didn't see much talk around IMD.

I was getting terrible results on loopback. Switching to your settings cleared it up. Very helpful. Thanks!
It's better now, but yours looks better.
It's better now, but yours looks better.
Attachments
Last edited:
Here is the same setup at 1kHz which probably explains the IMD 😉It's better now, but yours looks better.
Attachments

How would I wire up for a loopback measurement? Would everything be the same as when measuring an amp (per diagram in post #1) just without the amp in the chain? E.g. the 10W 8ohm resistor must still be used? Would the output be set to 0.35v Vrms (1Vpp) as a standard for this measurement? Thank you.
Thank you. I followed that procedure but it appears to measure the frequency response of the sound card, which is not what I was trying to achieve (I am also not sure it is needed as sound cards are mostly linear -Scarlett 2i2 gen4 in my case).
I was trying to replicate what I saw in the first post of this thread:
This appears to measure the harmonic profile of the generator and measuring interface without the amp present. I don’t know how to replicate this. A 10k value is mentioned, what is this?
I’d like to get a read on this so I can breakdown harmonic contribution of both the generator and the amp once I measure an amp.
I may have misunderstood something. Appreciate the help.
I was trying to replicate what I saw in the first post of this thread:
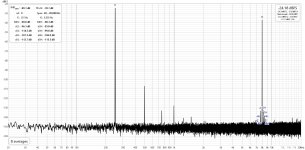
Update June 3, 2019: Here is a loopback using Focusrite Solo gen2 and Akitika 2ppm 1kHz oscillator at 1.0Vpp into 10k:

This appears to measure the harmonic profile of the generator and measuring interface without the amp present. I don’t know how to replicate this. A 10k value is mentioned, what is this?
I’d like to get a read on this so I can breakdown harmonic contribution of both the generator and the amp once I measure an amp.
I may have misunderstood something. Appreciate the help.
Juist do the loop back as described, turn on the generator set to 1K, adjust the output amplitude to whatever you want and then start the RTA.
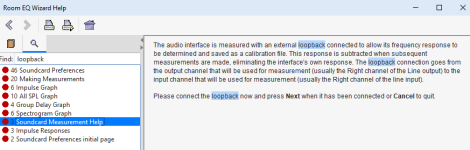
Presumably you have done the loopback calibration procedure.
You do not leave the load resistor in circuit.
Presumably you have done the loopback calibration procedure.
You do not leave the load resistor in circuit.
A loopback normally shows up the harmonics introduced by the DAC and output stage of the soundcard, as well as the following input stage and ADC of the soundcard. All those sections (DAC, amp stages and ADC) will contribute some level of harmonics - nothing is perfect. Hopefully you have a soundcard where those residual harmonics are close to or below the achievable noise floor - but not every one does - and those sections do start to contribute very noticable harmonics when signal levels/clipping become excessive - so there is a need to know/appreciate when that happens for your own soundcard.
The plot in post #1 you refer to does not use the soundcard's DAC and output amp stage - so if the external oscillator was perfect, then the plot would be showing the soundcard's input amp and ADC related harmonics. The external oscillator is working into a 10k load, which may be the loading presented by the soundcard input or an external 10k included in the setup - that 10k may well relate to a loading that suits the oscillator, or may relate to the soundcard - and may have been noted to allow comparisons to be made.
The plot in post #1 you refer to does not use the soundcard's DAC and output amp stage - so if the external oscillator was perfect, then the plot would be showing the soundcard's input amp and ADC related harmonics. The external oscillator is working into a 10k load, which may be the loading presented by the soundcard input or an external 10k included in the setup - that 10k may well relate to a loading that suits the oscillator, or may relate to the soundcard - and may have been noted to allow comparisons to be made.
I have a question related to this topic; Is there any way to measure distortion below 10Hz with REW? I want this for adjusting the air gap of SE OPTs.
You can set the oscillator to whatever frequency you want to examine the distortion. In REW, you can also do a sweep and get distortion vs frequency.
Not with sweeps. The REW measurement sweep is only logarithmic above 10 Hz, it uses a linear sweep from DC to 10 Hz if the measurement start frequency is below 20 Hz to ensure sufficient low frequency energy without spending excessive time at very low frequencies. That puts a 10 Hz lower bound on sweep distortion results. You could use the RTA (remember to turn off the distortion high pass limit in the Distortion settings) either at spot frequencies or using stepped sine.Is there any way to measure distortion below 10Hz with REW?
- Home
- Design & Build
- Software Tools
- How to - Distortion Measurements with REW