Hornresp Update 5060-200310
Hi Everyone,
This update has required extensive modifications to the program, and it is possible that something has been missed / overlooked during testing. Could you please report any bugs.
CHANGE 1
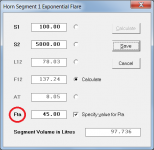
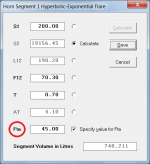
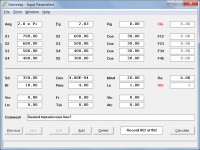
When the Horn Segment Wizard is used with an exponential or hyperbolic-exponential segment, double-clicking on the Cir label now changes the parameter from Cir to Fta, which means that the Horn Segment Wizard can now calculate both the throat entry half-angle AT and the mouth flare tangent angle Fta for all horn segment flare types. Post #10419 and Attachments 1 and 2 refer.
CHANGE 2
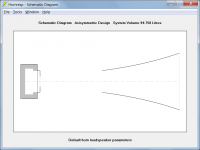
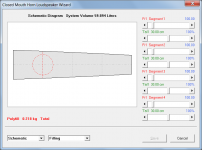
A loudspeaker with an offset driver can now also have an offset port, an offset passive radiator or an offset stub.
Method:
1. Specify at least three segments, select the OD offset driver option and double-click the Cir or Fta label in edit mode to select the Clo closed horn mouth option. Set Vrc, Lrc, Vtc and Atc = 0.
2. Specify an offset port using Ap and Lpt, a passive radiator using Sp, Cmp, Mmp and Rmp, or an offset stub using Ap1 and Lp.
For further information see the following entries in the Loudspeaker Models section of the Help file:
Direct Radiator in a Closed-Box Enclosure With Offset Driver and Stub
Direct Radiator in a Closed-Box Enclosure With Offset Passive Radiator
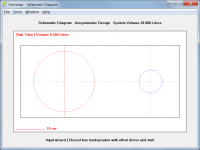
Direct Radiator in a Vented-Box Enclosure With Offset Port
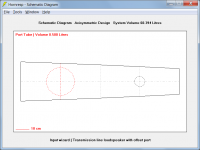
Damped Transmission Line Enclosure with Offset Port
Representative examples of the above four systems can be generated using the Input Wizard. Attachments 3, 4, 5 and 6 refer.
CHANGE 3
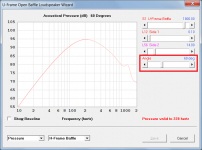
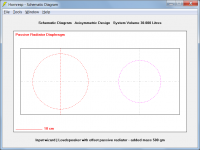
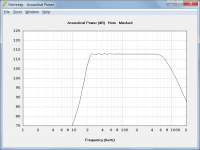
The H-Frame Loudspeaker Wizard pressure response chart can now be calculated at any specified angle between 0 and 180 degrees, not just at the 0 and 180 degree limits. Attachment 7 refers.
CHANGE 4
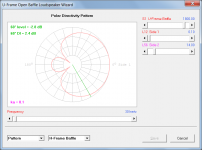
The H-Frame Loudspeaker Wizard now includes a directivity pattern. Attachment 8 refers.
BUG FIX 1
The overflow error problem detailed in Post #10425 has now been fixed. My thanks to Jack (nc535) for reporting the bug.
BUG FIX 2
The H-Frame Loudspeaker Wizard allowed the S1 slider control to have a baffle area value less than the driver diaphragm area, which was causing the wizard to operate incorrectly. This has now been fixed - it is no longer possible for S1 to be less than the diaphragm area.
BUG FIX 3
If a U-Frame loudspeaker record was selected, and the schematic diagram of another record then displayed, if the "U" baffles were on the left-hand side, segment 1 was not being shown in the second record. Attachment 9 refers. This bug has now been fixed.
Kind regards,
David
Hi Everyone,
This update has required extensive modifications to the program, and it is possible that something has been missed / overlooked during testing. Could you please report any bugs.
CHANGE 1
When the Horn Segment Wizard is used with an exponential or hyperbolic-exponential segment, double-clicking on the Cir label now changes the parameter from Cir to Fta, which means that the Horn Segment Wizard can now calculate both the throat entry half-angle AT and the mouth flare tangent angle Fta for all horn segment flare types. Post #10419 and Attachments 1 and 2 refer.
CHANGE 2
A loudspeaker with an offset driver can now also have an offset port, an offset passive radiator or an offset stub.
Method:
1. Specify at least three segments, select the OD offset driver option and double-click the Cir or Fta label in edit mode to select the Clo closed horn mouth option. Set Vrc, Lrc, Vtc and Atc = 0.
2. Specify an offset port using Ap and Lpt, a passive radiator using Sp, Cmp, Mmp and Rmp, or an offset stub using Ap1 and Lp.
For further information see the following entries in the Loudspeaker Models section of the Help file:
Direct Radiator in a Closed-Box Enclosure With Offset Driver and Stub
Direct Radiator in a Closed-Box Enclosure With Offset Passive Radiator
Direct Radiator in a Vented-Box Enclosure With Offset Port
Damped Transmission Line Enclosure with Offset Port
Representative examples of the above four systems can be generated using the Input Wizard. Attachments 3, 4, 5 and 6 refer.
CHANGE 3
The H-Frame Loudspeaker Wizard pressure response chart can now be calculated at any specified angle between 0 and 180 degrees, not just at the 0 and 180 degree limits. Attachment 7 refers.
CHANGE 4
The H-Frame Loudspeaker Wizard now includes a directivity pattern. Attachment 8 refers.
BUG FIX 1
The overflow error problem detailed in Post #10425 has now been fixed. My thanks to Jack (nc535) for reporting the bug.
BUG FIX 2
The H-Frame Loudspeaker Wizard allowed the S1 slider control to have a baffle area value less than the driver diaphragm area, which was causing the wizard to operate incorrectly. This has now been fixed - it is no longer possible for S1 to be less than the diaphragm area.
BUG FIX 3
If a U-Frame loudspeaker record was selected, and the schematic diagram of another record then displayed, if the "U" baffles were on the left-hand side, segment 1 was not being shown in the second record. Attachment 9 refers. This bug has now been fixed.
Kind regards,
David
Attachments
-
 Attach_1.png30.4 KB · Views: 325
 -
 Attach_9.png44.4 KB · Views: 149
 -
 Attach_8.png52.3 KB · Views: 145
 -
 Attach_7.png58.2 KB · Views: 144
 -
 Attach_6.png46.6 KB · Views: 148
 -
 Attach_5.png47.5 KB · Views: 345
 -
 Attach_4.png47.6 KB · Views: 313
 -
 Attach_3.png47.2 KB · Views: 319
 -
 Attach_2.png30.6 KB · Views: 320
Advanced Driver Parameters
Hi Everyone,
The website linked below is interesting.
Speakerbench
Kind regards,
David
Hi Everyone,
The website linked below is interesting.
Speakerbench
Kind regards,
David
Looks like a rather major revision. I'm at a point where I really don't know or understand all the possible ways to use Hornresp ! But I do appreciate what I can do with it. Thanks for all the devoted work to allowing us to create accurate reliable simulations David.
If I'm is Auz I'd love to pay you a visit.
If I'm is Auz I'd love to pay you a visit.
Looks like Claus has been busy! I've used his DPC for over 10 years. This looks pretty interesting. Hopefully it will be available for download to.
Looks like a rather major revision. I'm at a point where I really don't know or understand all the possible ways to use Hornresp ! But I do appreciate what I can do with it. Thanks for all the devoted work to allowing us to create accurate reliable simulations David.
If I'm is Auz I'd love to pay you a visit.
Me too!
Yes, I already have a change request, LOL.
The frequency ranges that are currently selectable in Hornresp are 1-2000 Hz and 10-20,000 Hz. Could a 1-200 Hz or 10-200 Hz option be added? Most of the time it looks like Hornresp is being used to design subwoofers, so ensuring that the range below 200 Hz is highlighted in Hornresp's FR graphs might be of additional assistance.
The frequency ranges that are currently selectable in Hornresp are 1-2000 Hz and 10-20,000 Hz. Could a 1-200 Hz or 10-200 Hz option be added? Most of the time it looks like Hornresp is being used to design subwoofers, so ensuring that the range below 200 Hz is highlighted in Hornresp's FR graphs might be of additional assistance.
Is it possible to model a Sealed Transmission line with Horn Resp?
I'm guessing sealed with stub lets me model sealed transmission line.🙂
Is it possible to model a Sealed Transmission line with Horn Resp?
Hi camplo,
See attachments.
Kind regards,
David
Attachments
Could a 1-200 Hz or 10-200 Hz option be added?
Hi Brian,
That's an easy one - it's not going to happen 🙂.
The complications it would introduce in the Loudspeaker Wizard in particular, don't bear thinking about! It was extremely tricky just getting the current arrangement to work correctly. It may seem to be a relatively simple thing to do, but unfortunately, for Hornresp at least, this is not the case. It is possible to sample down to 0.1 Hz, and to export data down to 1 Hz, which will have to suffice.
Kind regards,
David
Do you foresee being able to use the calculate function along with fill material calculated in? It would be nice to see spectrogram readings along with dampening material. Also, is it possible to show the spectrogram below 40hz? Thank you for HornResp btw, you are a life saver.
Do you foresee being able to use the calculate function along with fill material calculated in?
Including absorbent filling material in the main calculations would create a whole new set of operational problems. It's not going to happen.
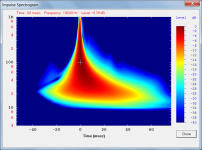
Also, is it possible to show the spectrogram below 40hz?
The 40Hz to 10Khz frequency range was recommended by Jean-Michel Le Cléac’h, the author of the spectrogram algorithms used in Hornresp. I have no plans to change these limits.
So no pianist uses all 88 keys?
Sadly Jean-Michel is no longer with us, but I am pretty sure that given his very generous sharing nature, he would have had no objection to a lower-frequency range option being added to his exceedingly clever spectrogram chart. I had a look last night, and found that it is a relatively simple matter to provide an alternative 4Hz to 1KHz scale when the 1Hz to 2KHz frequency range is being used for other charts - as shown in the attachments.
I suspect that Jean-Michel's reason for recommending the 40Hz to 10Khz frequency range originally, was because he was mainly interested in the performance of mid-range horn loudspeakers - especially ones that used his brilliant Le Cléac’h horn profile 🙂.
The spectrogram lower-frequency range option will be included in the next Hornresp update. Plans do change sometimes...
Attachments
So no one designs subwoofers?
If you are interested in any more of my ideas...
On the units of the graph, the increments are progressive but also change-able, with a double click, on certain views. In the future if you included within the options, smaller increments that would be awesome. A lot of times I am trying to see exactly what my xmax is, for example, but the increments keep my destination somewhere in the middle of several numbers....to work around this sometimes I'll go to the mode that allows you to create a crossover, and start bending the curve until the increments align where I need them and I can see them opposed to the baseline.
Thank you for using my idea for the spectrogram.
I lika dah colours!
So a lower frequency range spectrogram. That could prove to be useful. Thanks Master McBean.
So a lower frequency range spectrogram. That could prove to be useful. Thanks Master McBean.
- Home
- Loudspeakers
- Subwoofers
- Hornresp