Robh3606 said:[BHello Earl
Could you just move the microphone in an arc above and below the chosen midpoint and then rotate the box on the stand? Just keep the distance fixed with a piece of string.
Am I missing something??
Rob 🙂 [/B]
I can't move the microphone. I have a very small space and I only get enough "time window" with a very precise microphone location.
Hey, its not that its impossible to do, Its just not as easy as I first thought and ain't gonna happen on this next data run. There are other much higher priorities.
Off topic but I've been puzzling over how to get LspCAD to do accurate off-axis modeling of a horn system. So, as a last resort, I decided to R T F M. 😉 It turns out to be really simple if you have the off-axis measurements of a driver or driver+horn. I'm used to importing a text file with the usual Hz, dB and degrees columns for each driver and using the piston size to estimate the off-axis response. What I didn't know is the file can contain more than one measurement separated by a line reading "## EXTENDED DATA ## OFF AXIS <X,Y>" where X and Y are the degrees off axis. So a little copy/paste in a text editor and you can combine all the files into one. Pretty cool, you can now optimize your crossover for off-axis response and run polar sims of the whole system that will be as accurate as your measurements of the individual drivers.
Member
Joined 2003
Attachments
gedlee said:
I can't move the microphone. I have a very small space and I only get enough "time window" with a very precise microphone location.
Hey, its not that its impossible to do, Its just not as easy as I first thought and ain't gonna happen on this next data run. There are other much higher priorities.
Have you considered shipping your speakes off to NWAA Labs in California?? 3D polar measurements would be cool 😀 its even less then a set of Abbeys 😉 Worth it IMO.
http://nwaalabs.ipower.com/our_services.html
I read this on AVS....
http://www.avsforum.com/avs-vb/showthread.php?p=16618619#post16618619
NWAA Labs in California will measure complete polar speaker anechoic frequency response to 5 degree angular resolution for $1350!
http://nwaalabs.ipower.com/our_services.html
Speakers manufacturers have no excuse not to measure their products and provide detailed data on them -- other than that their speakers can't cut it, and they'd rather not have us know this.
- Terry
__________________
Terry Montlick Laboratories
Home Theater Acoustics
Critical Listening Rooms
Design, Evaluation, Alpha Certification®
www.tmlaboratories.com
doug20 said:
Have you considered shipping your speakes off to NWAA Labs in California?? 3D polar measurements would be cool 😀 its even less then a set of Abbeys 😉 Worth it IMO.
Doug, you and I live in completely different financial worlds I am afraid. Whenever there is money involved you are I are on completely different wavelengths.
You pay the bill and the speakers are on the next shipment!!
bear said:Since it is now summer, the possibility of outdoor testing is available! 😀
_-_-bear
Not where I live I'm affraid.
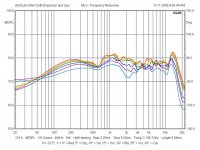
You can see by the time stamps what it took to do it using a simple modification of Rob's method; I didn't rotate anything.
Open them both in separate windows or tabs and click between them like we did in the HOM-measuring thread.
Markus reported that he could hear the vertical nulls in his Nathans just by moving his head up and down. It's unclear what distances were involved, and whether they were toed-in as recommended or not. In any case, they were certainly prominent in his on-axis measurements. Perhaps he will clarify this for us.
Oddly, Earl's comment was that the 10" Nathan waveguide is too small, whereas I'm using a $6 apiece 6" square 90° axisymmetric JBL Progressive Transition waveguide @ 1.8 kHz in the measurements above. There MUST be an insidious diffraction device in here somewhere:
Attachments

gedlee said:
Doug, you and I live in completely different financial worlds I am afraid. Whenever there is money involved you are I are on completely different wavelengths.
You pay the bill and the speakers are on the next shipment!!
I see your point but our previous discussion on CNC stuff was for much more $$$ and it was a risk for what I thought was some potential markets, anyways.
I actually thought $1400 for 3rd party 3D polar response testing was/is very reasonable for companies selling speakers but on the other hand does spending that $1400 increase sales?? Probably not so you position is probably the correct one.
btw, I heard weather sucks up there, can not believe its so cold in June!! 😱
doug20 said:
btw, I heard weather sucks up there, can not believe its so cold in June!! 😱
I would hardly call it sucks! Its been cool, which is fine with me, still 70's and sunny, thats great weather as far as I am concerned. But they say this has been the coolest June in 50 years - Global warming!?
I don't like the heat. Thailand was almost unbearable at times - give me "cool" anyday to that.
The tooling thing is quite different since I really can't do that myself, I can do polars - to my satisfaction at least. You have to remember that I don't buy into all this vertcal polar fixation. I am passionate about the horizontal pattern and I go to great lengths to get those right, but I can get that data with no trouble. It's the data that "others" want me to do that is a problem.
I'm very very curious to do some thermal measurements as I am convinced that this is the key to what people call "dynamics". But there aren't any good tests for it, so I'd like to develop one. I've recommended some tests and now I'd like to try them out. Thats far more important to me than oblique vertical polars - interesting as they may be academicaly.
" But there aren't any good tests for it"
It doesn't seem like it would be that hard, especially compared to 3D polar measurements.
How about tone bursts starting from a low level and increasing in 10 dB increments.
Overlay the results, which at some level will show compression.
Or did you mean that the hard part is not doing the test but deciding on what the input signal should be?
Also, calculating the thermal time constant of the VC/former is straightforward if you can get that info.
Barring that, you could conservatively ignore the formerand possibly deduce the amount of wire by its DCR and some of the other parameters.
noah katz said:" But there aren't any good tests for it"
It doesn't seem like it would be that hard, especially compared to 3D polar measurements.
How about tone bursts starting from a low level and increasing in 10 dB increments.
Overlay the results, which at some level will show compression.
Or did you mean that the hard part is not doing the test but deciding on what the input signal should be?
Also, calculating the thermal time constant of the VC/former is straightforward if you can get that info.
Barring that, you could conservatively ignore the formerand possibly deduce the amount of wire by its DCR and some of the other parameters.
Its not "compression" that I am concerned with. There are good tests for that, its "dynamics" which is more a factor of the time aspects of the problem. I think the rest of your post makes MY case for its not being clear cut.
This subject was talked about a lot in another thread and some people concluded that it was "done", but I'm not yet convinced.
What I plan to do is used modulated noise at very high power. Fiorst I will get the input signals LP filtered power (i.e. the signal squared) which will give me the energy of the signal versus time, then I will cross correlate this signal with the quotient of the voltage across the driver to the current into it (maybe these quantities squared, or a PSD, etc.) and LP filter that. The later signal is "close" to the time variations of the electrical Re of the driver (or system). From this data I should be able to get the time response of Re relative to the input power, i.e. the thermal time constants on a very short scale, i.e. tenths of millisec. There are lots of variations of this that could involve FFTs etc. but they all come down to the same basic idea - thermally modified impedance versus power input on very short time scales.
The standard compression tests are all based on long term thermal aspects which are a completely different set of thermal variations and time constants.
At any rate this is way off topic and if you want to continue lets go to a new thread.
I don't like the heat. Thailand was almost unbearable at times - give me "cool" anyday to that.
Im jealous, I like Thailand for the 'culture' 😀....Try India, that heat and smell is unbearable.
Of course I live in Florida...95 today and 100% humidty...like suana.
Sorry everyone for the OT!!!
doug20 said:
Im jealous, I like Thailand for the 'culture' 😀....
That "culture", which really isn't at all endemic to Thai culture, could land you with something life-threatening (..and I don't mean heat stroke).
 😀
😀ScottG said:
That "culture", which really isn't at all endemic to Thai culture
I lived there for two years. It is endemic. It is part of the culture, part of life and a natural and proud occupation.
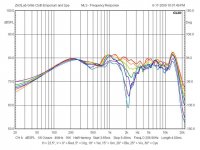
Josh, I think the first one is mic above the speaker and the second one is mic below the speaker.
JoshK said:Zilch,
What is the second polar graph you posted? It has no description.
@ 1105?
That's the vertical in the downward direction below horizontal at the junction of the woofer and waveguide. #1104 is the vertical upward. At 0°, the distance to the mic is 42". The spread in mic height was 48" for +/- 30°. Does that pass sanity check? Seems so, at 29.74°. Mic distance calcs to 48.37" at the extremes, which translates to how much attenuation?
Maybe Catapult will run a sim on that system and we'll see how well it agrees with the actual.
I'll fire it up again and perhaps I can make a determination of the offset of the acoustic centers, though the sim will likely beat me to the answer.... 😀
gedlee said:
I know of no one who does polars about some non axial location and hence I know of no data that one can even look at. Its an interesting question.
Let's call me "First," then, m'kay? 😉
Re-measured the Nathan today. I did 15 measurements on a vertical straight line 1m in front of the speaker on 0°, each 5cm apart. Window time is 3ms, nearest boundary was >1m away:
Waveguide center:
Best, Markus
An externally hosted image should be here but it was not working when we last tested it.
Waveguide center:
An externally hosted image should be here but it was not working when we last tested it.
Best, Markus
- Status
- Not open for further replies.
- Home
- Loudspeakers
- Multi-Way
- Horn vs. Waveguide