I would want the impulse responses exactly like Farina shows them in his paper - as raw data that can be read into another program for further analysis - with the higher order harmonics leading the linear one. This would allow for some very useful analysis. All these packages do too much of what I don't want and not eneough of what I do. None of them does polar maps.
Member
Joined 2003
Hi Earl,
Sorry it took a few days to get back to this, but I've been helping a buddy with his new HT.
Here's another shot at smoothing the transition. This time, the driver wall is tangent to a small radius which is then joined to a larger throat radius to further decrease the rate of change.

I was thinking the abrupt angle at the exit of the "throatless" style driver would have been important to diffraction. So the flat wavefront at the driver exit makes the angle moot? Smoothing the WG entry is not worth pursuing?
Paul
Sorry it took a few days to get back to this, but I've been helping a buddy with his new HT.
Here's another shot at smoothing the transition. This time, the driver wall is tangent to a small radius which is then joined to a larger throat radius to further decrease the rate of change.
I was thinking the abrupt angle at the exit of the "throatless" style driver would have been important to diffraction. So the flat wavefront at the driver exit makes the angle moot? Smoothing the WG entry is not worth pursuing?
Paul
markus76 said:<broken record>http://www.four-audio.de/en/products/elf.html</broken record>
I guess that I'm missing your point.
Paul W said:Hi Earl,
Here's another shot at smoothing the transition. This time, the driver wall is tangent to a small radius which is then joined to a larger throat radius to further decrease the rate of change.
I was thinking the abrupt angle at the exit of the "throatless" style driver would have been important to diffraction. So the flat wavefront at the driver exit makes the angle moot? Smoothing the WG entry is not worth pursuing?
Paul
What you are trying to do here is to correct the bad phase plug design with the waveguide. Maybe this can be done, maybe not. I'd have to say that at this point it would be a guess since I've not looked into the problem in any detail. I would say that I can see as many new problems being created as the problem that it fixes. In the end it would take some substantial experimentation to sort out how to optimize the good and minimize the bad. Quite honestly, I would just redo the phase plug - correctly - and go with that. I think that it would be easier.
Hello Earl,
I guess I was with my friend Jean Leung one of the very first users of Angelo Farina's method here in France.
Arta while very convenient doesn't allow to manage all of the parameters of the measurement. I prefer for myself to have a clear control of every parameter in the measurement process.
Thats why I still use inside Adobe Audition 2 plugins for Adobe Audition from Pr. Farina (after having used them long time in CoolEDit 200 and in CoolEDit Pro).
Those 2 plugins the user licence of which I bought very cheap are:
GENSWEEP :
http://pcfarina.eng.unipr.it/Aurora_XP/Generate Sweep signal.htm
and CONVOLVE:
http://pcfarina.eng.unipr.it/Aurora_XP/Convolve with Clipboard_Ver4.htm
There is also a package for Adobe Audition with many interesting functions written by Angelo Farina including Convolve and Gensweep:
http://pcfarina.eng.unipr.it/Aurora_XP/Package.htm
About the harmonics components of the distortion they are very clearly separated as individual pulses on the signal recovered through the convolution. It is most useful.
Though... their complete analysis has to be perfomed exporting the spectrum of each harmonics from Adobe Audtion (I do that in Excel) cause you'll have to divide the frequency and multiply the level of each harmonics according to its order to recover the classical presentation (my friend Francis Brooke wrote a macro for excel to do that).
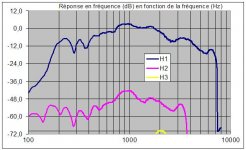
Attached a graph showing the result for a very cheap Adastra compression driver mounted on a Vitavox 190 horn. (very low H3 as seen on the yellow curve).
Best regards from Paris, France
Jean-Michel Le Cléac'h
I guess I was with my friend Jean Leung one of the very first users of Angelo Farina's method here in France.
Arta while very convenient doesn't allow to manage all of the parameters of the measurement. I prefer for myself to have a clear control of every parameter in the measurement process.
Thats why I still use inside Adobe Audition 2 plugins for Adobe Audition from Pr. Farina (after having used them long time in CoolEDit 200 and in CoolEDit Pro).
Those 2 plugins the user licence of which I bought very cheap are:
GENSWEEP :
http://pcfarina.eng.unipr.it/Aurora_XP/Generate Sweep signal.htm
and CONVOLVE:
http://pcfarina.eng.unipr.it/Aurora_XP/Convolve with Clipboard_Ver4.htm
There is also a package for Adobe Audition with many interesting functions written by Angelo Farina including Convolve and Gensweep:
http://pcfarina.eng.unipr.it/Aurora_XP/Package.htm
About the harmonics components of the distortion they are very clearly separated as individual pulses on the signal recovered through the convolution. It is most useful.
Though... their complete analysis has to be perfomed exporting the spectrum of each harmonics from Adobe Audtion (I do that in Excel) cause you'll have to divide the frequency and multiply the level of each harmonics according to its order to recover the classical presentation (my friend Francis Brooke wrote a macro for excel to do that).
Attached a graph showing the result for a very cheap Adastra compression driver mounted on a Vitavox 190 horn. (very low H3 as seen on the yellow curve).
Best regards from Paris, France
Jean-Michel Le Cléac'h
markus76 said:
gedlee said:I would want the impulse responses exactly like Farina shows them in his paper - as raw data that can be read into another program for further analysis - with the higher order harmonics leading the linear one. This would allow for some very useful analysis. All these packages do too much of what I don't want and not eneough of what I do. None of them does polar maps.
Attachments
Jean-Michel
Thanks for the posts.
I find the graphics in Excel very disappointing and it has only limited capability. I use MathCAD which can do everything in one package with no need to use clipbords etc. It is also completely flexible - you can do anything that you can think of by just writting the math, MathCAD does the rest. Its a far more capable system in total than anything else that I have ever seen. I have used CoolEdit for years, to simply look at Wav files its great, but it gets very cumbersome when trying to do any kind of calculations.
Hello Earl,
I don't use Mathcad myself but I write many things with Matlab (specially image analysis for work and few audio) .
In attached file an output of a (unfinished) waterfall program I wrote under Matlab for my own use (unlike conventional waterfall routines it uses a window the width of which is variable with frequency).
Best regards from Paris, France
Jean-Michel Le Cléac'h
gedlee said:Jean-Michel
Thanks for the posts.
I find the graphics in Excel very disappointing and it has only limited capability. I use MathCAD which can do everything in one package with no need to use clipbords etc. It is also completely flexible - you can do anything that you can think of by just writting the math, MathCAD does the rest. Its a far more capable system in total than anything else that I have ever seen. I have used CoolEdit for years, to simply look at Wav files its great, but it gets very cumbersome when trying to do any kind of calculations.
Attachments

I would recommend just model the thing and do some sims.Paul W said:Hi Earl,
Sorry it took a few days to get back to this, but I've been helping a buddy with his new HT.
Here's another shot at smoothing the transition. This time, the driver wall is tangent to a small radius which is then joined to a larger throat radius to further decrease the rate of change.
I was thinking the abrupt angle at the exit of the "throatless" style driver would have been important to diffraction. So the flat wavefront at the driver exit makes the angle moot? Smoothing the WG entry is not worth pursuing?
Paul
Jean-Michel:
Many thanks for posting the info about Audition...
While I have used this program extensively for years, I had not utilized the Convolution effect.
It is a powerful tool in a variety of scenarios
Syd
Many thanks for posting the info about Audition...
While I have used this program extensively for years, I had not utilized the Convolution effect.
It is a powerful tool in a variety of scenarios
Syd
Member
Joined 2003
Agree...I intend to catch up with you in Axi-Driver and model different options in the next few weeks. At the moment, time is tight.I would recommend just model the thing and do some sims.
gedlee said:These are the level of graphics that I am used to http://www.ai-audio.com/images/esp15graphs.png
You can generate this level of graphics in Matlab too. Whether or not it is easier or more convenient, I have no idea, I don't use MathCad, although I plan to get it. I use Matlab a LOT at work, but that is for a completely different application which MathCad would be of no use.
JoshK said:
You can generate this level of graphics in Matlab too. Whether or not it is easier or more convenient, I have no idea, I don't use MathCad, although I plan to get it. I use Matlab a LOT at work, but that is for a completely different application which MathCad would be of no use.
Matlab is well known for its graphics, but also its price.
I am willing to bet that anything that you can do with Matlab can be done in MathCAD. SVD - no problem, eigenvalues, matrices, it does it all from what I can tell. The advantage that it has is that, unlike MatLab, MathCAD does math exactly like you write it. Its not as criptic as Matlab and when done a MathCAD sheet is pretty much self documenting because its just the equations written out like you would write them out if you were writting it down on paper. Its just that in the end MathCAD spits out an answer, and when you write it down, that doesn't happen.
MathCAD also has an algebra processor which MatLab does not.
I thought it would be interesting to look at differences between SPL responses from stepped sine wave and mls measurements.
See if this inspires any thoughts.
An externally hosted image should be here but it was not working when we last tested it.
See if this inspires any thoughts.
setup parameters?
Without giving the setup parameters for these, it's kinda meaningless to attempt an interpretation. You know, window length, physical setup, smoothing, etc.
Or are you implying that the ONLY difference is the signal function? If so, why not explain that difference to us.
John L.
soongsc said:I thought it would be interesting to look at differences between SPL responses from stepped sine wave and mls measurements.
An externally hosted image should be here but it was not working when we last tested it.
See if this inspires any thoughts.
Without giving the setup parameters for these, it's kinda meaningless to attempt an interpretation. You know, window length, physical setup, smoothing, etc.
Or are you implying that the ONLY difference is the signal function? If so, why not explain that difference to us.
John L.
Only difference is signal type and SPL offset. No smoothing in either measurment. MLS uses rectagular window. Both measurements were taken one right after the other without any changes. Without going into details, it seems to me that one reveals more effects related with diffraction right in the vicinity of the diaphram. Not all driver show this significant difference.
I know that some like using swept sine, and wonder how the results reveal difficiencies in speaker/driver design. I'm sure that math processing will effect the results as well. But whenever I look at nice and smooth looking graphs, I just wonder what is hidden.🙂
I actually started doing these comparisons when someone looked at this particular driver and said: "How can the response look so ugly?"😀
hello Soongsc,
Stepped sine signals are not very different than spectrum of weighted sweep except that only discrete frequencies are calculated (so at each frequency we can mesure a pure sine of the duration we want).
The spectrum then is drawn just passing through the measured points at those discrete frequencies. It is easy to understand that if the interval is large between two points the segment between the 2 points may hidden the real variation of the spectrum...
This method is more often used for extracting spectrums from noisy signals. IMHO it is not very useful in audio measurements.
The purpose of MLSA or/and convolution after a logsweep (Angelo Farina's method) is do deliver in a first step a pulse of very high energy (longer is the sequence of the MLSA signal or longer is the logsweep, the larger is the signal/noise ratio. With 30 seconds of logsweep the signal/noise ratio may be amplified by 70 decibels or more compared to a classical single pulse measurement! )
Then in a second step the spectrum is obtained in the exact same conditions for the 2 kind of pulses. (But the pulse obtained by convolution + logsweep is less noisy so its spectrum is more revealing).
Best regards from Paris, France
Jean-Michel Le Cléac'h
soongsc said:Only difference is signal type and SPL offset. No smoothing in either measurment. MLS uses rectagular window. Both measurements were taken one right after the other without any changes. Without going into details, it seems to me that one reveals more effects related with diffraction right in the vicinity of the diaphram. Not all driver show this significant difference.
I know that some like using swept sine, and wonder how the results reveal difficiencies in speaker/driver design. I'm sure that math processing will effect the results as well. But whenever I look at nice and smooth looking graphs, I just wonder what is hidden.🙂
I actually started doing these comparisons when someone looked at this particular driver and said: "How can the response look so ugly?"😀
Jean-Michel and Soongsc
Soongsc is saying that the MLS is more revealing. In this setup it is, but thats a matter of how the system is setup. Clearly the sine sweep is too fast, which equates to an "averaging" process in the frequency domain.
Can we NOT clutter this thread with measurement issues as these have all been discussed before.
- Home
- Loudspeakers
- Multi-Way
- Geddes on Waveguides