I'll see if I can come up with an easy way of explaining the filter Qs.
Here's an equation that was derived empirically:
Q = 0.5 + 0.1/power(frequency_ratio_up, 1.5) + 0.1/power(frequency_ratio_down, 1.5);
Where frequency_ratio_up is the ratio of each crossover frequency to the next higher crossover frequency. Similarly, frequency_ratio_down is the ratio of each crossover frequency to the next lower crossover frequency. When there is no higher or lower crossover frequency, remove that term. (For this reason, lowest and highest crossover frequencies have slightly lower Qs than the ones in the middle.
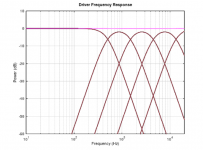
In the example I gave in the OP, there are 4 crossovers. The ratio of crossover frequencies is fixed at 2.36. Thus the Qs are:
0.52758
0.55516
0.55516
0.52758
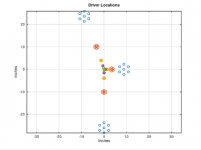
Here is more economical version. 4-way with 10 drivers and LR24 linear-phase crossover.
Mechanical possibilities are closing to reality, though not yet entirely reached with those driver locations.
I don't care too much about excessive Duelundish theories because contact to reality and common sense is very thin...nonexistent.
Mechanical possibilities are closing to reality, though not yet entirely reached with those driver locations.
An externally hosted image should be here but it was not working when we last tested it.
An externally hosted image should be here but it was not working when we last tested it.
I don't care too much about excessive Duelundish theories because contact to reality and common sense is very thin...nonexistent.
Here is more economical version. 4-way with 10 drivers and LR24 linear-phase crossover.
Mechanical possibilities are closing to reality, though not yet entirely reached with those driver locations.
To quote TBTL from the first page of this thread:
"How are the polars along the diagonals?"
I don't care too much about excessive Duelundish theories because contact to reality and common sense is very thin...nonexistent.
Personally, I find it's much easier to simplify/modify an established approach known to generate the type of results I'm looking for than to start from scratch.
"How are the polars along the diagonals?"
Diffraction simulator does not support diagonals, and planar should be replaced temporarily with 49x49mm square. So the result is less accurate than hor and ver planes earlier. Not perfect as expected, but not so terrible either.
An externally hosted image should be here but it was not working when we last tested it.
Personally, I find it's much easier to simplify/modify an established approach known to generate the type of results I'm looking for than to start from scratch.
Agree that existing simplified theory is easier to control, but unfortunately theoretical magnitude & phase matching >decade above and below XO frequencies does not help with real life drivers, and listener is not clued into constant spot at infinity. Therefore all non-humorous discussion about seeking excessive phase match at least with actual speakers causes some headache 🙂
Duelund(ish) multiway xo isn't difficult at all to achieve with dsp in horizontal window say +/-30¤. And because it sounds better than non-optimized, I like it!
My base is LR2 which continues elliptically past the xo up to next adjacent xo. I check this by attenuating mid and checking how W and T sum. Acoustic slopes, measured at 1,5m and smoothed to hide reflections. If drivers behave too badly off-band, this approach is not wise and steeper slopes will work better, by hiding nonlinearities.
My base is LR2 which continues elliptically past the xo up to next adjacent xo. I check this by attenuating mid and checking how W and T sum. Acoustic slopes, measured at 1,5m and smoothed to hide reflections. If drivers behave too badly off-band, this approach is not wise and steeper slopes will work better, by hiding nonlinearities.
Duelund(ish) multiway xo isn't difficult at all to achieve with dsp in horizontal window say +/-30¤.
You are talking about horizontal plane to measurement distance. That is totally different than any possible listening distance to any elevation within normal/possible vertical listening window compared to theories >decade above XO with several decimal accuracy.
In addition, you better hold your horses until you have purchased measurement gear which is able to capture phase differences. Not some usb crap in single channel mode which gives possibility to evaluate subjectively by reverse null only.
I better stay out to save myself from this.
Diffraction simulator does not support diagonals, and planar should be replaced temporarily with 49x49mm square. So the result is less accurate than hor and ver planes earlier. Not perfect as expected, but not so terrible either.
PIC
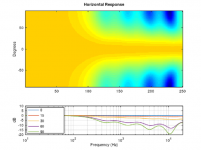
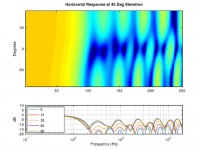
Is there some unexpected normalization going on here? Why does the 0 degree response look uniform across frequency, when the response should be nearly omni below 100 hz, but have significant attenuation above? See the pictures I posted in post 8 of this thread.
Agree that existing simplified theory is easier to control, but unfortunately theoretical magnitude & phase matching >decade above and below XO frequencies does not help with real life drivers, and listener is not clued into constant spot at infinity. Therefore all non-humorous discussion about seeking excessive phase match at least with actual speakers causes some headache 🙂
The nice thing about having minimum phase target response curves is that speakers are minimum phase devices (for the most part). That goes a long way toward mitigating the issue of phase tracking and matching.
Here is more economical version. 4-way with 10 drivers and LR24 linear-phase crossover.
Mechanical possibilities are closing to reality, though not yet entirely reached with those driver locations.
An externally hosted image should be here but it was not working when we last tested it.
An externally hosted image should be here but it was not working when we last tested it.
I don't care too much about excessive Duelundish theories because contact to reality and common sense is very thin...nonexistent.
I took a shot at replicating your simplified design. I allowed another nest rather than generating a planar tweeter, to save myself some trouble. That shouldn't make much difference, particularly not below 8 or 9 kHz. The vertical and horizontal polars look OK, but the diagonals are pretty bad, IMO. They don't match the ones you posted, which I don't trust. Let me know if you see an important aspect that was missed or simulated erroneously.
Attachments
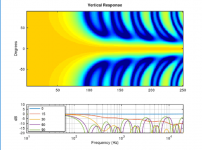
The vertical and horizontal polars look OK, but the diagonals are pretty bad, IMO. They don't match the ones you posted, which I don't trust.
They can't match because rotation center in your simulation is not at the center point of speaker. Only thing that we can really trust is that these simulations are always inaccurate.
They can't match because rotation center in your simulation is not at the center point of speaker. Only thing that we can really trust is that these simulations are always inaccurate.
My simulated measurement positions are all equidistant from the point 0,0 depicted on my driver location plot, which is the center of the speaker. I don't know why you would be convinced otherwise. I have built and measured a speaker based on this approach, and found my simulation to be highly accurate at predicting polar response.
Edit:
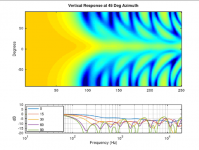
If you compare the response in my "Horizontal Response" plot (which uses an elevation angle of 0) at 45 degrees azimuth to the response in my "Vertical Response at 45 Deg Azimuth" at 0 degrees elevation, you will see that both plots show a similar response. In contrast, a cut across your diagonal plot at 0 doesn't match an off-axis response from your other plots. Instead, the cut at 0 across your diagonal plot is flat. That's inaccurate.
Last edited:
The nice thing about having minimum phase target response curves is that speakers are minimum phase devices (for the most part). That goes a long way toward mitigating the issue of phase tracking and matching.
Not exactly minimum-phase, and no guarantee that crossover "device" IRL is capable to produce custom elliptical slopes (other than textbook Bessel) or control phase response so that acoustical slopes could be EQd "back" to minimum-phase, linear-phase or exact phase match with others within two decades to any point in full space.
I suppose we agree that:
a) Perfect match is valid theoretical representation to make graphs more readable and avoid trivial questions.
b) Target for axial response could be ideal including four cascaded 2nd order stages and five decimals in Q factors, but axial response - perfect or not to single point in full space - does not define alone how speaker sounds.
This is OT which I started so I also end my part right here.
Instead, the cut at 0 across your diagonal plot is flat. That's inaccurate.
That is as accurate as can be because 0 deg response in any diagonal rotation is axial response. I suppose we need some graph to get agreement what is diagonal rotation.
That is as accurate as can be because 0 deg response in any diagonal rotation is axial response. I suppose we need some graph to get agreement what is diagonal rotation.
I thought it was pretty clear how I interpreted it (at least for anyone familiar with azimuth and elevation angles). I understand now that you didn't try to replicate what I did. You created a different plot along a different axis. I think your interpretation may be more in line with what TBTL expected. However, it looks like my interpretation was better at showing warts in polar response (which I think was the point of the question).
Last edited:
However, it looks like my interpretation was better at showing warts in polar response (which I think was the point of the question).
I prefer rotation planes which cross reference axis because that enables calculation of power response and directivity index with simple dual plane (hor+ver) method. That is quite expected strategy also with measurement systems using turning table. For example:
An externally hosted image should be here but it was not working when we last tested it.
Both rotation systems are able to cover all points in full space.
I prefer rotation planes which cross reference axis because that enables calculation of power response and directivity index with simple dual plane (hor+ver) method. That is quite expected strategy also with measurement systems using turning table. For example:
Both rotation systems are able to cover all points in full space.
Both systems may be able to cover all points in space, but your technique passes through the reference axis every single time, which becomes quite redundant. I suspect the reason I was able to highlight issues with the polar response of your proposed simplification is because I showed more of the response away from the reference axis.
I'm not familiar with the dual plane method of calculating DI. It sounds problematic to me, but perhaps it's different from what I'm imagining.
..your technique passes through the reference axis every single time, which becomes quite redundant.
That's true, but we should remember also here that VituixCAD main program is crossover simulator which relies on measurement data. That is usually easiest to capture by rotating speaker around it's own origin, or by rotating mic around speaker's origin. That leads to previous rotating system at least in simple home labs with limited space.
VituixCAD has also free adjustment for origin (X,Y mm) and plane azimuth (Phi in previous image) but that feature is not public. That enables simulation to half or full circumference below, above, left or right side of the speaker. That works with simulated circular drivers to half space only because loaded measurement data can have two planes.
I'm not familiar with the dual plane method of calculating DI.
It's very simple weighting with sin-function which eliminates need of diagonal planes. It's not so accurate if diagonal planes are much different than average of intensity in hor & ver planes. Power response can be calculated with the same system if pressure points around whole sphere are not available.
Last edited:
I suspect the reason I was able to highlight issues with the polar response of your proposed simplification is because I showed more of the response away from the reference axis.
Quite many simulations done in the morning. I would say that "my" diagonal rotation method reveals directivity issues much easier and clearer because difficult diagonal planes are visible much longer in directivity charts such as polarmap.
One thing which probably caused misleading differences is diffraction simulation. I had diffraction simulation in response data but you did not. Result is worse without diffraction. But I can confirm that three drivers per way does not give very good result. Four drivers per way is better to diagonals because risk to form just M-MM pair is reduced. Not so economical anymore but gives more freedom to select and locate drivers than six.
If you have anything that simulates particularly well, I'd be interested to see it.
I wonder if it would make sense at this time to write a small tutorial about how to design multi-way CBTs (either analog or FIR). Obviously there is strong agreement between your sims and mine (despite some miscommunications and bickering), and there is no doubt that the approach is workable.
A rough draft:
1) Determine the size of speaker you want to build. (max)
2) Determine the vertical and horizontal beamwidths you want.
3) Determine how low in frequency you'd like constant beamwidth (base frequency)
4) Note that beamwidth in degrees is about 51*C/(Frequency*length). (C is the speed of sound.)
5) Adjust Height, width, and frequency until satisfied with compromises
6) Design a nest of speaker locations that spans the appropriate height and width for your desired beamwidths. Note that if you have too much separation between speakers you'll get high sidelobes (keeping speakers within half a wavelength guarantees sidelobes wont get too high). Also note that you'll want to arrange them so that smaller nests will fit inside without interference. You may want to run a quick sim and check polars at your base frequency (ignore higher frequencies). Also note, rear chambers will be needed to isolate speakers from each "way" from speakers in any other "way".
7) Pick a tweeter (or tweeter size) and see at what frequency its directivity has the best match to your desired directivity.
8) Pick crossover frequencies between your base frequency and your tweeter's high pass frequency. (Don't separate crossover frequencies by more than a factor of 3, and sometimes closer to 2 will work better.)
9) Higher frequency speaker nests are similar to the base nest, but shrunk by the ratio of the crossover frequencies.
10) Analog crossovers can be made with cascaded 2nd order filters at every crossover frequency. Like most 2nd order filters, polarity inverts from one band to the next. Q = 0.5 + 0.1/power(frequency_ratio_up, 1.5) + 0.1/power(frequency_ratio_down, 1.5); Where frequency_ratio_up is the ratio of each crossover frequency to the next higher crossover frequency. Similarly, frequency_ratio_down is the ratio of each crossover frequency to the next lower crossover frequency. When there is no higher or lower crossover frequency, remove that term. (For this reason, lowest and highest crossover frequencies have slightly lower Qs than the ones in the middle.)
11) Pick midranges, fullranges, and/or woofers to use. There may be simplifications that can be made, where a smaller number of drivers of a certain size can be about as effective as a larger number.
12) Design a box with appropriate dimensions and volume for your speakers.
13) Simulate. Use measured speaker responses if possible.
14) Make adjustments.
15) Build box, and install drivers.
16) Measure
17) Design crossovers based on in-box measurements and target response curves. Simplify where possible. It's not typically necessary to build 6th or 8th XOs even when called for by the theory in step 10.
17) Build crossovers
18) Measure
19) Adjust until satisfied
20) Enjoy.
Last edited:

- Status
- Not open for further replies.
- Home
- Loudspeakers
- Multi-Way
- Fractal Array Straight CBT with Passive XOs and no EQ