I think 6,5" will struggle without subwoofers in your fairly large space... depending on the listening level of course. Are you sure you can't make room for wider baffles than 40cm?
Even in a 5x6x2,6m room?I think 6,5" will struggle without subwoofers in your fairly large space... depending on the listening level of course. Are you sure you can't make room for wider baffles than 40cm?
Wider baffles would require some new negotiations. 😎 😏 no guaranty on success though...
the visual from 40 to 50cm is quiet obvious....
The 2-way from https://drive.google.com/file/d/1Pug0AA54HXHrcQgFjCLT0sXs-sVI0MlS/view has the proper size...but squeezing in a 3-way with 8" ? 🤔
Just my humble IMO... Making a wide floorstanding cabinet with curved baffle for just a 2-way is insane.
And I would use 12" woofer, sealed and Hypex FA253. A 3-way is quite a challenge as first own design... Start with simple boxes and follow good recipes first. Gather tools and knowhow to use them, including paintjob. Perhaps there is a club of amateur woodworkers and cabinet makers in your city? Amount of dust and fumes and need for space might give a surprice...
Have fun!
Start collecting points, and eventually you will win the negotiation 😉
I've been thinking about 15" woofers on wide baffles (well, cant make them narrow really) in my living room (5x4m maybe)..
It also has a big impact if the room is open or closed, in my case the living room is open to the rest of the apartment, so bass 'leaks' everywhere. Maybe better for some room modes, but takes more to 'pressurize' the room. I have read a lot about the 'bass presence' with large woofers even at lower volumes, so that's what I would like to try next.
Yes same as with cars I guess..nothing can replace a big engine. Small engine with turbo isnt the same. Same with big woofers....nothing to replace a big diafram.Start collecting points, and eventually you will win the negotiation 😉
I've been thinking about 15" woofers on wide baffles (well, cant make them narrow really) in my living room (5x4m maybe)..
It also has a big impact if the room is open or closed, in my case the living room is open to the rest of the apartment, so bass 'leaks' everywhere. Maybe better for some room modes, but takes more to 'pressurize' the room. I have read a lot about the 'bass presence' with large woofers even at lower volumes, so that's what I would like to try next.
Thanks, you certainly have a point. It difficult decision. building Bookshelf speaker is difficult to convince my partner. Because I have some already some so why I need more... Then going 3-way, she start complaining about the size. Also dont like to have the speakers into the room...difficult for cleaning etc... Im interested in wide baffle hence my search. Not many around and I came across Troels PMS.Just my humble IMO... Making a wide floorstanding cabinet with curved baffle for just a 2-way is insane.
And I would use 12" woofer, sealed and Hypex FA253. A 3-way is quite a challenge as first own design... Start with simple boxes and follow good recipes first. Gather tools and knowhow to use them, including paintjob. Perhaps there is a club of amateur woodworkers and cabinet makers in your city? Amount of dust and fumes and need for space might give a surprice...
Have fun!
Squeezing a 12"in a 25L box will be difficult I guess...even a 8"is just just....
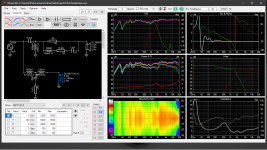
For creating some confidence in TRACED manufacturer plots, I made traces for the drivers used in THE RuleBreakers . Put some delay on the woofer 57us/20mm
The outcome is not near the original 🙁 ...so confidence lost 🙁

SPL plot : Dip on woofer from 500-1K Hz
Group delay and Phase = OK
Power and DI : bump around 2K Hz.
In room has big diviation from 2K Hz
Impedance isnt far off : Around 500Hz the impedance =15Ohm were in the original is close to 18Ohm.
The outcome is not near the original 🙁 ...so confidence lost 🙁
SPL plot : Dip on woofer from 500-1K Hz
Group delay and Phase = OK
Power and DI : bump around 2K Hz.
In room has big diviation from 2K Hz
Impedance isnt far off : Around 500Hz the impedance =15Ohm were in the original is close to 18Ohm.
Attachments
Last edited:
The lack of confidence is warranted. There are a number of reasons why it will be difficult to compare the two. The real measurements only have +-10V which will not show the power dip and DI bump from an in phase LR crossover.The outcome is not near the original 🙁 ...so confidence lost 🙁
SPL plot : Dip on woofer from 500-1K Hz
Group delay and Phase = OK
Power and DI : bump around 2K Hz.
In room has big diviation from 2K Hz
Impedance isnt far off : Around 500Hz the impedance =15Ohm were in the original is close to 18Ohm.
The phase in the original measurement isn't wrapped which makes it harder to compare against a wrapped phase plot.
The impedance in yours peaks at 500Hz instead of 250Hz in the measurement.
The real measurements were made with a 4.8ms gate stitched to nearfield with baffle diffraction, so resolution in the measurement is being lost below 1K with 400 to 500Hz having the lowest resolution and most smoothing, making it hard to compare.
What Does this mean? The dip is there in reality too? 🤔The lack of confidence is warranted. There are a number of reasons why it will be difficult to compare the two. The real measurements only have +-10V which will not show the power dip and DI bump from an in phase LR crossover.
The measurement also show a peak at 500Hz.The phase in the original measurement isn't wrapped which makes it harder to compare against a wrapped phase plot.
The impedance in yours peaks at 500Hz instead of 250Hz in the measurement.
What I did, was taking the TRACED curves. Put them into the diffraction tool. Put the driver on the right place on the baffle with mic in the centre. Axis distance was set to 316mm (distance from IEC measurements?)The real measurements were made with a 4.8ms gate stitched to nearfield with baffle diffraction, so resolution in the measurement is being lost below 1K with 400 to 500Hz having the lowest resolution and most smoothing, making it hard to compare.
The dip gets worse as the measurement is made further off axis, so it not there within 10 degrees but is further off axis. The In room estimate includes enough further off axis angles for it to show up.What Does this mean? The dip is there in reality too? 🤔
You are right I was distracted by the phase being almost the same colour.The measurement also show a peak at 500Hz.
Trying to work out a manufacturers measurement conditions, undoing them and adding in simulated baffle diffraction is not easy to get valid data from. Just part of the variability in success of this method of simulation.What I did, was taking the TRACED curves. Put them into the diffraction tool. Put the driver on the right place on the baffle with mic in the centre. Axis distance was set to 316mm (distance from IEC measurements?)
Thanks, is there a standard to which off axis should be included?The dip gets worse as the measurement is made further off axis, so it not there within 10 degrees but is further off axis. The In room estimate includes enough further off axis angles for it to show up.
You are right I was distracted by the phase being almost the same colour.
Trying to work out a manufacturers measurement conditions, undoing them and adding in simulated baffle diffraction is not easy to get valid data from. Just part of the variability in success of this method of simulation.
I thought it would be a bit easier when going wide baffle to use the manufacturer plots.
What I didnt do is "undo" the IEC baffle diffraction.
What bother me the most in this outcome is FR dip from 500-1k5. That 2-3db.
And the DI bump at 2K. I removed the +-V above 20 but still the same outcome.
The manufacturer conditions are mentioned below the graphs.
When I do the same exercise on Paul Carmody's CARRERA I end up much much closer...
From CTA 2034Thanks, is there a standard to which off axis should be included?
Code:
5.2 Post Processing of Data
The following composite response curves shall be calculated. In each instance a power average
of the specified magnitude responses shall be calculated.
Listening Window
The listening window curve is a spatial average of the nine magnitude responses in the ±10º
vertical and ±30º horizontal angular range.
• 0°
• ± 10º vertical
• ± 10º, ± 20º, ± 30º horizontal

Early Reflections
The early reflections curve is an estimate of all single-bounce, first-reflections, in a typical
listening room.
• Floor Bounce: 20º, 30º, 40º down
• Ceiling Bounce: 40º, 50º, 60º up
• Front Wall Bounce: 0º, ± 10º, ± 20º, ± 30º horizontal
• Side Wall Bounces: ± 40º, ± 50º, ± 60º, ± 70º, ± 80º horizontal
• Rear Wall Bounces: 180º, ± 90º horizontalTry an ideal driver of the same size in the baffle diffraction simulation and see what you get.What bother me the most in this outcome is FR dip from 500-1k5. That 2-3db.
This comes from the crossover and can only be undone with a different type of crossover. A DI bump means a power dip which is not really a big problem to be worried about.And the DI bump at 2K. I removed the +-V above 20 but still the same outcome.
So much more can be at play, the low end response bounces back in all SB's plots which is not what will happen in any realistic use case.The manufacturer conditions are mentioned below the graphs.
Thanks for the information....Im getting smarter each day 😎 😛 Now just trying to remember everything 😛From CTA 2034
Code:5.2 Post Processing of Data The following composite response curves shall be calculated. In each instance a power average of the specified magnitude responses shall be calculated. Listening Window The listening window curve is a spatial average of the nine magnitude responses in the ±10º vertical and ±30º horizontal angular range. • 0° • ± 10º vertical • ± 10º, ± 20º, ± 30º horizontal Early Reflections The early reflections curve is an estimate of all single-bounce, first-reflections, in a typical listening room. • Floor Bounce: 20º, 30º, 40º down • Ceiling Bounce: 40º, 50º, 60º up • Front Wall Bounce: 0º, ± 10º, ± 20º, ± 30º horizontal • Side Wall Bounces: ± 40º, ± 50º, ± 60º, ± 70º, ± 80º horizontal • Rear Wall Bounces: 180º, ± 90º horizontal
Try an ideal driver of the same size in the baffle diffraction simulation and see what you get.
This comes from the crossover and can only be undone with a different type of crossover. A DI bump means a power dip which is not really a big problem to be worried about.
So much more can be at play, the low end response bounces back in all SB's plots which is not what will happen in any realistic use case.
This is the diffraction responce of a 6" on IEC baffle. Only mild bump of +.5 db round 100-200Hz, dip of -.3 350 and 750 Hz. So the manufacture response is quiet smooth.
But here I get confused :
6" on 380x1050 baffle at 575 from bottom with axis distance 316mm (same as on IEC meausrement)
or same thing with axis distance = 2500mm
different result.
I can not lay my finger on what to fill in om axis distance?
You can try the IEC baffle at 316mm to generate the diffraction you need to remove from the manufacturers plot to have a true half space response.I can not lay my finger on what to fill in om axis distance?
Then you can use that in the actual baffle simulation where you would then select the intended listening/measuring distance.
What I would remove is what is in the is shown in the first graph of previous plot right. This one is quiet smooth. So dont know if it worth to do simulation.You can try the IEC baffle at 316mm to generate the diffraction you need to remove from the manufacturers plot to have a true half space response.
Diffraction responce of a 6" on IEC baffle. Only mild bump of +.5 db round 100-200Hz, dip of -.3 350 and 750 Hz. So the manufacture response is quiet smooth.
That would be the last graph from previous post with axis at 2500mm distance.Then you can use that in the actual baffle simulation where you would then select the intended listening/measuring distance.
I exported that plot and put it into the driver and crossover.
I raised the level with 80.5 db (manufacturer said efficiency = 86.5db. Plot from diffraction is raised 6db. 80.5+6 = 86.5)
outcome is a little bit better. The dip in 500-1k is smaller but still there. Tweeter level is too high. DI bump is still there. 😕
Dont know what is wrong...something with the design? plots? The way I use vituixCAD? I assume the last but dont know what 🤔
What happens if you play around a bit with the driver offsets? Maybe it has partially to do with summation? (not sure how to read the phase plots in VC).
As a general comment, I would probably try to do something about the 1k hump in the tweeter HP slope, at least a listening test with and without impedance correction if it's the resonance frequency of the tweeter.
As a general comment, I would probably try to do something about the 1k hump in the tweeter HP slope, at least a listening test with and without impedance correction if it's the resonance frequency of the tweeter.
VC plot is a bit messy because there or other drivers shown as well. Only RED and orange curve is valid.What happens if you play around a bit with the driver offsets? Maybe it has partially to do with summation? (not sure how to read the phase plots in VC).
Doesnt change much...really strange. It doesnt resemble the original. above 2k FR is reased 3db.As a general comment, I would probably try to do something about the 1k hump in the tweeter HP slope, at least a listening test with and without impedance correction if it's the resonance frequency of the tweeter.
bump at 400Hz isnt there and there is a dip of almost 5db at 600Hz
Made some sims with the drivers TRACED curves adapted to the baffle Im going to use.
Dont know which one is better.... 🤔 Or maybe they are both bad....😛😏.
One with smooth directivity. Tweeter and mid are 90degrees out of phase.

One with smoother on axis. Directivity dip around 3-5k.

Directivity within 1db.

Directivity 3-5k 3db diff.

Dont know which one is better.... 🤔 Or maybe they are both bad....😛😏.
One with smooth directivity. Tweeter and mid are 90degrees out of phase.
One with smoother on axis. Directivity dip around 3-5k.
Directivity within 1db.
Directivity 3-5k 3db diff.
Try a waveguided tweeter? You improve both directivity matching and time alignment by doing it..
IMHO phase tracking between drivers is good for depth in the sound stage, I would not like to compromise on that.
IMHO phase tracking between drivers is good for depth in the sound stage, I would not like to compromise on that.
In the design where phase is 90degrees between both drivers, they track each other from around 1K till 5K. At 1k the tweeter is 25db down. at 5k mid is 15db down.Try a waveguided tweeter? You improve both directivity matching and time alignment by doing it..
IMHO phase tracking between drivers is good for depth in the sound stage, I would not like to compromise on that.
In the designs where phase is same, they track each other from 800Hz till 3K.
at 800Hz, tweeter is 10db down , at 3K woofer is 7db down.
First one is the better one? 🤔
- Home
- Loudspeakers
- Multi-Way
- First project : Troels PMS with SBacoustic drivers ; advice and help most welcome