That's really convenient!No magic or special scripts required, just RTFM...
So it took all of about 30 minutes of "suck it and see" to get 99% of the way...
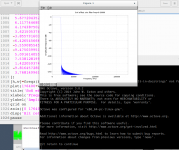
The sneaky trick is the --plot option. What this does with selected SoX effects is to generate a command file which allows you to plot the transfer curve of the effect in Matlab or Octave.
When I first checked using the manual example the results weren't particularly promising - the resulting file contained a couple of equations of the transfer function and plotting commands.
Next attempt using the rate option that John S discusses in posts linked earlier in the thread was a waste of time. It basically doesn't work with --plot option, so no go.
Having a look through the effects listing I noticed that the "sinc" option used the same switches as "rate" but supported --plot. Now we are getting somewhere....
So after a quick peek at the manual page...
Holy CRaP™!! the output plot file contained 1016 filter coefficients!Code:sox --plot octave /path/to/input.wav /path/to/output.wav sinc -20k -I -n 1016 > plot.plt
The sampling rate is based on the input.wav, so you need short (1 second is enough) files with 358.2k and 384k sampling rates for FIR1.
From the SoX "rate" documentation...
I'm excited. 😉
Code:
sox --plot octave -v0.965 --buffer 32768 -r44100 test.wav -r352800 soxup-vMa.wav rate -vMa sinc -20k -I -n 1016 > plot.pltAttachments
That's really convenient!
Import it into matlab and so easily preview the figures with plot toolkit. But why the "b" is 1581 instead of 1016?Code:sox --plot octave -v0.965 --buffer 32768 -r44100 test.wav -r352800 soxup-vMa.wav rate -vMa sinc -20k -I -n 1016 > plot.plt
Yes that is what I've found too...
Not sure exactly why.
OK, the SoX experiment looks promising but the sinc function is a bit different to rate.
rate bundles together upsampling, filtering and dithering in a fairly simple interface.
whereas sinc is purely used for filtering.
This is fine as the DAM handles upsampling, and you would hope that there is some kind dithering done - although Søren has not mentioned this anywhere that I've seen.
It does mean that going from suggested rate settings is going to require a little bit of translation.
A couple of things I've noted..
The default 95% band-width in rate is referenced to -3dB point. sinc on the other hand defines the width of the transition band (default 5%) based on frequency specified at -6dB point.
By default rate is -3dB at fs/2 * 0.95. At 44.1kHz sampling rate this gives a default corner frequency at 22050*0.95 = 20974.5hz.
You can determine the corner frequency from the percentage given for -b with rate. NB: sinc uses -b to set the beta coefficient for the kaiser windowing function, so you cannot transfer the value set by -b between the two.
Another issue is that it is difficult to control the number of taps. I suspect I'm missing something in this regard that isn't 100% clear from the docs.
anyway this appears to be the easiest way to do controlled intermediate filters.
I'm a bit pushed for time, so that will have to do unless I find some spare time later today. Will be away from the Dam and laptop for a bit over a week.
rate bundles together upsampling, filtering and dithering in a fairly simple interface.
rate [−q|−l|−m|−h|−v] [override-options] RATE[k]
whereas sinc is purely used for filtering.
sinc [−a att | −b beta] [−p phase | −M | −I | −L] [−t tbw | −n taps] [freqHP][−freqLP [−t tbw | −n taps]]
This is fine as the DAM handles upsampling, and you would hope that there is some kind dithering done - although Søren has not mentioned this anywhere that I've seen.
It does mean that going from suggested rate settings is going to require a little bit of translation.
A couple of things I've noted..
The default 95% band-width in rate is referenced to -3dB point. sinc on the other hand defines the width of the transition band (default 5%) based on frequency specified at -6dB point.
By default rate is -3dB at fs/2 * 0.95. At 44.1kHz sampling rate this gives a default corner frequency at 22050*0.95 = 20974.5hz.
You can determine the corner frequency from the percentage given for -b with rate. NB: sinc uses -b to set the beta coefficient for the kaiser windowing function, so you cannot transfer the value set by -b between the two.
Another issue is that it is difficult to control the number of taps. I suspect I'm missing something in this regard that isn't 100% clear from the docs.
anyway this appears to be the easiest way to do controlled intermediate filters.
I'm a bit pushed for time, so that will have to do unless I find some spare time later today. Will be away from the Dam and laptop for a bit over a week.
In my opinion the passband for the higher sampling rate (88,96 and up) FIR1 filters should also only be something up to 20kHz while the stopband can be at higher frequencies than for the 44/48 case. At least I would wish such a filter set as option.
I think the main benefit of the higher sampling rates is that it makes live easier for building nice filters (as well for recording as for playback). All of my high sample rate recordings, I have looked at, have no content above -90dB from 18kHz, or at most 22kHz, on upwards.
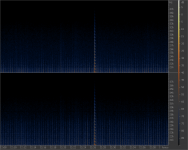
... unless they are (or seem to be) converted DSD recordings which have a (noise) signal reaching higher levels above 35kHz again:
View attachment 471397
As they say "you can prove anything with statistics" Lies, damned lies, and statistics - Wikipedia, the free encyclopedia
Averaged response is great for finding underlying long term behaviours but useless for showing short term peaks in energy.
This is a spectrogram of a short segment of the HD Tracks 192/24 release of Miles Davis' So What.
I've configured so that the lowest energy value displayed is -90dB. FFT size 4096 and uses a Hann window. You can see the trumpet note - which is loud - has harmonics above -90dB out to
35kHz. There are harmonics on the same note which are above -65dB out to 28kHz, and above -55dB out to 23kHz.
While it might be the case that this is above the range of hearing of most people, I'd be loathe to filter detail from a recording because there is at least the possibility it may influence perception of the audio.
http://jn.physiology.org/content/83/6/3548
Of course you are free to use what ever filters you want.
cheers
Paul
Attachments
Last edited:
Got it! Few parameters changed but taps got 1017 with "-n 1016".Yes that is what I've found too...
Not sure exactly why.
abbreviated:
sox --plot octave -r44100 test.wav -b 24 -r352800 soxup-vMa.wav rate -vMa sinc -20000 -M -n 1015 > sox_vMa.plt
ok. 1015 taps as type.
Attachments
I'm really enjoying CrapMagic! Great work!
Agree! Been listening to it for the past 3hrs.
This just a real quick and dirty one, so no graphs or details just the filter.
I came across a post by John Swenson on the Bottlehead forum in which he mention that the filter he'd settled on used 80db attenuation in the stop band, and was intermediate phase.
John also expressed a preference for short filters, but this one is 932 taps so doesn't really qualify. I'd specified something like 750 taps, but there is something else happening that is influencing the resulting number of taps. It seems if you use a linear phase the result is very close, but minimum phase blows out the tap count.
I've found that SoX creates much shorter filters if you don't attempt to specify a specific number of taps or alter the transition band from the default 5%.
Doesn't sound too bad but it's more a test case for using SoX than anything particularly refined.
cheers
Paul
Attachments
...I've configured so that the lowest energy value displayed is -90dB. FFT size 4096 and uses a Hann window. You can see the trumpet note - which is loud - has harmonics above -90dB out to
35kHz. There are harmonics on the same note which are above -65dB out to 28kHz, and above -55dB out to 23kHz. ...
I do not advocate for a brickwall at (say) 20kHZ. All I wanted to say, for higher sample rates, the design should not aim to be perfect reproduction up next to Nyqvist. I would treat some more ripple or attenuation above 20kHz for better behavior below 20kHz.
To put things in perspective: I turned my pre amp -80dB further when I powered the DAM off and so avoided hearing its devastating power-off spzzzzkt 😉 in my speakers.
But as you said with the DAM everyone is free to use the filters he wants to use. I like CrapMagic FIR2 by the way 🙂
Got it! Few parameters changed but taps got 1017 with "-n 1016".
abbreviated:
sox --plot octave -r44100 test.wav -b 24 -r352800 soxup-vMa.wav rate -vMa sinc -20000 -M -n 1015 > sox_vMa.plt
ok. 1015 taps as type.
With the --plot option the output wave shouldn't be created, but you still have to specify the file.
I created a 1 second file of white noise and then upsampled that to create small files at the required rate. I guess either way works well enough.
The 44.1kHz white noise wav is attached fwiw.
cheers
Paul
Attachments
I would treat some more ripple or attenuation above 20kHz for better behavior below 20kHz.
So would/will I. Half a dB will not do any harm. I would even trade some ripple below 20khz to get a more ideal stop band.
//
If you look at the frequency response of speakers and headphones (also the good,expensive...) you see variations in the range of some dB. So yes some 0.xx dB variation more, as only criterion, will surely not be the thing that makes the difference.So would/will I. Half a dB will not do any harm. I would even trade some ripple below 20khz to get a more ideal stop band.
//
Resampler-V DSP plugin for Foobar
I just found a very nice tool: Resampler-V DSP plugin for Foobar
It's a resampling/upsampling plugin for foobar with a very good interface.
It uses the SoX and SSRC library.
You can change the pass band, stop band, attenuation, phase and see the result in the graphs.
By adjusting the sliders you see live changing the graphs, very nice 🙂
To get to the GUI: Preferences, Playback, DSP manager, configure selected.
Regards,
Danny
Attachments
Last edited:
So would/will I. Half a dB will not do any harm. I would even trade some ripple below 20khz to get a more ideal stop band.
//
I'm assuming you realise we were talking about 88.2kHz and higher sampling rates?
It's worth reading Julian Dunn's paper "Anti-alias and Anti-imaging filtering: The benefits of 96kHz sampling rate formats for those who cannot hear above 20kHz."
http://www.nanophon.com/audio/antialia.pdf
The production of pre-echoes from filter ripple was reported by Lagadec and Stockham [6],. They found the pre-echo due to a filter ripple of ± 0.2dB with a span of 23Hz corresponded with echoes of -32dB at ±40ms - which was found to be quite perceptible even with untrained listeners.
cheers
Paul
I'm talking also 44,1. I dont mind +/- 0,3 dB ripple starting from say 15khz and goes -1,5 dB at 20Khz. Keep the phase within 5 deg to 15 khz,
Alias and mirrors be gone.
//
Alias and mirrors be gone.
//
SoX sinc tip
More a documentation post than anything else...
sinc -t flag sets the transition band in hz. From what I can determine the transition band is centred on the lowpass corner frequency set with -21k for example. If you set the transition band at 5000hz and the -6dB point to 21kHz the stop band will begin at 23.5kHz.
So if you wanted to make a minimum phase filter that is flat at 20kHz, and -80dB at 22.05kHz you'd do something like:
Which sets the -6dB point to 21kHz and the start of the stop band to 22.05kHz. -p0 is same as -M, and -p50 same as -L
Setting the number of taps using -n flag works well IF you use either Minimum or Linear phase. Using any intermediate phase (-p1 to -p49) results in over 50% more taps than specified.
cheers
Paul
More a documentation post than anything else...
sinc -t flag sets the transition band in hz. From what I can determine the transition band is centred on the lowpass corner frequency set with -21k for example. If you set the transition band at 5000hz and the -6dB point to 21kHz the stop band will begin at 23.5kHz.
So if you wanted to make a minimum phase filter that is flat at 20kHz, and -80dB at 22.05kHz you'd do something like:
Code:
sinc -a80 -p0 -21k -t2100Which sets the -6dB point to 21kHz and the start of the stop band to 22.05kHz. -p0 is same as -M, and -p50 same as -L
Setting the number of taps using -n flag works well IF you use either Minimum or Linear phase. Using any intermediate phase (-p1 to -p49) results in over 50% more taps than specified.
cheers
Paul
Been trying for a while now.I might have to drop this CRaP™ seeing we already have Schitt doing scat routines...
Anyhow, one more dose to keep things "regular"...
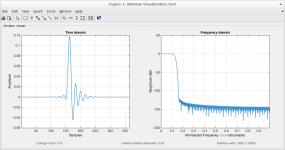
This is loosely modelled on the Dac Magic Linear Phase setting.
The original is -0.1dB @ 20kHz, -10dB at 22kHz, and hits -140dB at some unspecified point - seems to be 23-24Khz.
Obviously this has to be called...
TotalCRaP™'s CRaP™Magic - linear phase (v1)
............
For me, with my ears, my hifi-setup i feel there are better filters "out there". Went back to what I have used for a while now. "music" started flowing again....
Seems that playing with filters are quite individual whether we like it or not?
Will try the other filters when I have the time.
BTW: Have also connected a 10k linear pot and testing the volume control. Works like a charm 🙂
Best regards.
Last edited:
I just found a very nice tool: Resampler-V DSP plugin for Foobar
It's a resampling/upsampling plugin for foobar with a very good interface.
It uses the SoX and SSRC library.
Danny, thanks for the link!
Really useful tool, can't stop playing with the sliders 😀
Thanks for these functional parameters, that's the way to get the compromise between phase, delay, aliasing and ringing, eg. 'rate -M sinc -p30 -22050 -t12k' .More a documentation post than anything else...
sinc -t flag sets the transition band in hz. From what I can determine the transition band is centred on the lowpass corner frequency set with -21k for example. If you set the transition band at 5000hz and the -6dB point to 21kHz the stop band will begin at 23.5kHz.
So if you wanted to make a minimum phase filter that is flat at 20kHz, and -80dB at 22.05kHz you'd do something like:
Which sets the -6dB point to 21kHz and the start of the stop band to 22.05kHz. -p0 is same as -M, and -p50 same as -LCode:sinc -a80 -p0 -21k -t2100
Setting the number of taps using -n flag works well IF you use either Minimum or Linear phase. Using any intermediate phase (-p1 to -p49) results in over 50% more taps than specified.
cheers
Paul
Attachments
Danny, thanks for the link!
Really useful tool, can't stop playing with the sliders 😀
Now you guys just have to work out how translate these settings in to filters for the DAM and it will be something more than a toy....
- Home
- Source & Line
- Digital Line Level
- Filter brewing for the Soekris R2R


