BudP said:dlr,
Would you please bring Soonsgc's CSD plots forward and give me an education in which frequency response changes qualify as a valid change in FR and which qualify for no change in FR.
My understanding of what you are questioning is quite confused. If you are dwelling on my statement that I find no FR changes, please accept my apology, but I do not know what nor where that statement was in error. I truly do not see a change. Certainly not one that would be commensurate with the changes in phase, which seem quite large in nature to my uneducated eye. I am certainly willing to be educated.
Bud
I've been out all evening, but here goes.
The CSD plots are in this post:
soongsc measurements
An externally hosted image should be here but it was not working when we last tested it.
An externally hosted image should be here but it was not working when we last tested it.
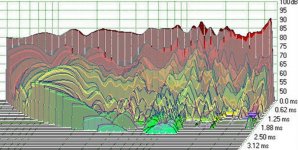
These were in your first post in reply to me. That's the set I focused on in addition to your attempts to describe what you believe the mechanism to be. There's a 10db change in the upper end response, but the problem is that these two should not be compared. The first one looks to be a very, very long window since the reverberation goes on showing little damping. The second one is a window with maybe a 3ms or so long window used. This alters the FFT calculation, so the 10db I saw is an artifact of different windowing. The fact that the first one shows almost no low frequency "curving" or "wrapping" with time indicates an extremely long window for a CSD. This is more indicative of an in-room response full of room reflections and reverberation.
The two to compare are the ones that soongsc posted later, although my focus was on the links you posted, still before I was in the thread, that do show a change of at least 3db. These two are:
An externally hosted image should be here but it was not working when we last tested it.
These two show little change at the top end, but a quick review show typical changes to resonances with application of any kind of damping material. The changes that stand out include:
- 9.5K - A reduction of at least 1db in an existing resonance
- 10K - A decrease of a dip by about 0.5db
- 13K - A decrease of about 3db in an existing resonance
- 14K - A new dip of about 3db
So here are at least four easily identifiable FR changes evident in standard MLS measurements. These are indicative of a damping mechanism or weight distribution that changes the resonant nature, good for reductions in the first three, but with a detrimental new dip in the fourth. Some drivers may exhibit good changes, but it's just as likely the a driver that is very good to start with may end up worse with treatment. Let me say that I would never, ever suggest that any mod should be considered universally an enhancement.
That said, for this example, had I made that kind of change through a mod, on balance I'd call it a success. I don't see any special mechanism involved other than weight/damping, typical of any applied material. Scan-Speak uses slit cones sealed with a damping application to re-seal it that is, I believe, the same slightly tacky material applied to the surround.
As john k said earlier, no change is just that, no change. If there is no change in FR, there will be unequivocally no change in the CSD nor in any other output from the driver.
The CSD is nothing more than successive FR results of the FFT using successively shorter windows done by the software, shortening the window by moving the start time marker farther (later) in time until the start and stop time markers coincide. It simply removes more and more of the early impulse data. This is why you'll see the low frequency tend to "wrap" towards the higher frequencies. This is because the frequency limit is moving up due to lessening impulse time data.
Still, it's all easily measured, nothing need be "invented" to measure it.
These don't show the phase response. I'd need a link to the measurements that you're referring to for this. Any change in phase, though, can only be related to the frequency response if the measurements and windowing are done properly. Any excess-phase difference that might be due to differing mic-driver distance can easily be corrected in post-processing. The phase (driver minimum-phase that is) will be essentially defined by the driver's passband frequency response. There are no piston drivers nor no mechanism that can violate this intrinsic characteristic.
Of course, none of this addresses changes in the driver's distortion characteristics.
Dave
A couple of thoughts:
Some speaker cones are far from smooth - I'm thinking of those which are covered with raised dots, perhaps to aid release from the manufacturing mould (I don't know). Do such dots or other irregularities have an effect comparable to EnaBL? Consider the 'pond' analogy, with a large number of poles crowding the pond, each just breaking the surface. The interactions with the wavefronts would be complex, but I'd expect a nett attenuation of reflections from the 'shore'.
Suppose that the pond were not circular, or even symmetrical. Would the chaotic reflection of wavefronts from the boundry layer be an advantage? (In other words, would useful cancellation occur?) There would appear to be no insurmountable difficulty in making a cone and its ancillary components an irregular shape if there's any advantage in doing so.
An extension of that thought: would the EnABL pattern work differently if applied eccentrically, or indeed in an irregular 'ring'?
Regarding cone mass. Having worked in the printing industry, I concur with Dave's observations regarding variation due to the weather (specifically, of course, the ambient humidity). I would expect such variations to swamp any gross mass-loading effects that application of EnABL patterns may have.
dlr,
Ok, that is all clear enough, though it looks to me like the dip at 14 k, or a little less, is more like 8 to 10 dB.
Here are the CSD vs phase graphs from Soongsc.
http://www.diyaudio.com/forums/showthread.php?postid=1227789#post1227789
It is my understanding that he added rings of toothpaste EnABL blocks for each CSD run, without moving anything on the aluminum cone Jordan or the microphone setup.
Here is what I understand to be that driver, at an unknown to me level of treatment, with respect to an individual CSD plot in the linked stack.
http://www.diyaudio.com/forums/showthread.php?postid=1226268#post1226268
Bud
BudP said:Dave Dlugos's materials are his concern, not that of EnABL. Not that I have any problem with anything he does, but they are not necessary for EnABL to function.
Indeed, i have been adding a bit of my own spice to the stew 🙂
dave
Looking at the plots what is going on from 30-40K. Don't you find it odd to see a rising response there? What type of driver are we measuring? Is that typical?
The differences between the two measurements could be microphone placement as an example or differences in set-up if they were taken at different times. Need more information about how they were taken to see if they could be set-up issues.
Any changes in the impedance curves between before and after? Shift in FS or changes out in the curve out above 5K?
Do any sine measurements to see if the distortion levels or content changes?
Rob🙂
Ah, only 5 dB, but all along the slope, there at 13 to 14 k. Thanks Dave.
Also looks like some changes out in the middle of the window, with missing humps, but, very hard to track the individual lines to be certain.
Bud
Also looks like some changes out in the middle of the window, with missing humps, but, very hard to track the individual lines to be certain.
Bud
and here is a blown up comp that shows the after has a subtly faster decay in the after (again on top).
I haven't heard Soong's drivers, but if these CSD/FR differences were the drivers i have been listening too, there is no way that i could see these subtle differences causing the differences that i am hearing.
If anyone wants the layered photoshop comps so that they can play with the transparency of the after/top layer to better see the differences please mail me.
dave
Edit. Dark hunps are before, lighter humps after.
Attachments
BudP said:Also looks like some changes out in the middle of the window, with missing humps, but, very hard to track the individual lines to be certain.
Indeed. I was working on the 2nd overlay just to show that. Any deeper compare would be a very large amount of work using a raster. Soong, can you output the CSD as a vector file?
dave
I'm not sure how to do it in SoundEasy. Is that some format like DXF format?planet10 said:
Indeed. I was working on the 2nd overlay just to show that. Any deeper compare would be a very large amount of work using a raster. Soong, can you output the CSD as a vector file?
dave
Bare in mind that with an aluminum cone, the applied material does not meet the requirements that Bud had specified.planet10 said:and here is a blown up comp that shows the after has a subtly faster decay in the after (again on top).
I haven't heard Soong's drivers, but if these CSD/FR differences were the drivers i have been listening too, there is no way that i could see these subtle differences causing the differences that i am hearing.
If anyone wants the layered photoshop comps so that they can play with the transparency of the after/top layer to better see the differences please mail me.
dave
Edit. Dark hunps are before, lighter humps after.
I have not listened to these drivers either since I do not have an enclosure designed for them. But based on my experience with other drivers, a difference can be heard, but not as significant. The most significant improvement starts when the second CSD curve drops at least 10db below the main curve.
CSD interpretation
Can the raw data generating these plots be output into, say csv format? Seems to me we're all looking for difference info here, so it wouldn't talke much to output to csv, feed into excel or your favorite spreadsheet, subtract the (looks like 15 data sets) from each other, then plot the difference info as a delta CSD.
Having manipulated data for many decades, I can see this interpretation as fraught with potential problems, as we have no input as to setup conditions. The delta values may be compromised by all sorts of systematic error, measurement bias, etc., none of which is being presented. It's much easier to draw the wrong conclusions from graphical data representation than the correct ones, imhe.
Not trying to sound negative, just pointing out some gotchas I've run into b4.
John L.
The issue to me is the lack of repeatability and reproducibility data on the measurements. The differences show up exactly where the measurements would be expected to be most sensitive to tiny changes in test conditions. Inadvertently moving the speaker or the mike even a few millimeters or a degree of angle is a definite possibility even when care is taken not to.
I don't know if my own measurements (which will include off axis) will show up differences beyond the envelope of repeatability, but we'll see. The controlled subjective stuff ought to be much more interesting.
I don't know if my own measurements (which will include off axis) will show up differences beyond the envelope of repeatability, but we'll see. The controlled subjective stuff ought to be much more interesting.
Re: CSD interpretation
John,
Thank you for your post which seems to be well-considered and coming from real-world conditions. Hopefully we can refine our data gathering and interpretation so any 'conclusions' drawn will be based in reality, rather than mere conjecture and speculation. My admittedly sparse experience with data gathering and interpretation mirrors your obversations. Hopefully those doing measurement will take advantage of the suggestions being posted and incorporate them into their protocols, yielding accurate data from which interpretation could illuminate the mechanisism(s) responsible for the aural phenomena being reported. FWIW, conclusions are not really an end-point of science, as new data can easily upset former theory and much present knowledge was formulated precisely in this manner. Science is always awaiting the next data set...and objectivity is difficult to find in human endeavor.
t
auplater said:Can the raw data generating these plots be output into, say csv format? Seems to me we're all looking for difference info here, so it wouldn't talke much to output to csv, feed into excel or your favorite spreadsheet, subtract the (looks like 15 data sets) from each other, then plot the difference info as a delta CSD.
Having manipulated data for many decades, I can see this interpretation as fraught with potential problems, as we have no input as to setup conditions. The delta values may be compromised by all sorts of systematic error, measurement bias, etc., none of which is being presented. It's much easier to draw the wrong conclusions from graphical data representation than the correct ones, imhe.
Not trying to sound negative, just pointing out some gotchas I've run into b4.
John L.
John,
Thank you for your post which seems to be well-considered and coming from real-world conditions. Hopefully we can refine our data gathering and interpretation so any 'conclusions' drawn will be based in reality, rather than mere conjecture and speculation. My admittedly sparse experience with data gathering and interpretation mirrors your obversations. Hopefully those doing measurement will take advantage of the suggestions being posted and incorporate them into their protocols, yielding accurate data from which interpretation could illuminate the mechanisism(s) responsible for the aural phenomena being reported. FWIW, conclusions are not really an end-point of science, as new data can easily upset former theory and much present knowledge was formulated precisely in this manner. Science is always awaiting the next data set...and objectivity is difficult to find in human endeavor.
t
subjective eval
hey Stuart...
when you set up to do the subjective stuff, maybe include some low level resolution material (as if you haven't already thought of this!). I was thinking perhaps 2 orchestral pieces superimposed that have periods of silence or low levels, maybe one of the movements from The Planets, with Saint Saens Organ symphony superimposed at -40 dB... kind of a Charles Ives thing..😀 ... see if the panel can differentiate the sounds
Also, Pink Floyd often has mumbling and talking at low levels in the background that always sounded indistinct until I built my planars... especially on Dark Side of the Moon... I recall hearing a woman's voice I think right b4 the "Time" segment...
or maybe I just forgot to take my pills, eh??😉
just some thoughts
John L.
SY said:The issue to me is the lack of repeatability and reproducibility data on the measurements. The differences show up exactly where the measurements would be expected to be most sensitive to tiny changes in test conditions. Inadvertently moving the speaker or the mike even a few millimeters or a degree of angle is a definite possibility even when care is taken not to.
I don't know if my own measurements (which will include off axis) will show up differences beyond the envelope of repeatability, but we'll see. The controlled subjective stuff ought to be much more interesting.
hey Stuart...
when you set up to do the subjective stuff, maybe include some low level resolution material (as if you haven't already thought of this!). I was thinking perhaps 2 orchestral pieces superimposed that have periods of silence or low levels, maybe one of the movements from The Planets, with Saint Saens Organ symphony superimposed at -40 dB... kind of a Charles Ives thing..😀 ... see if the panel can differentiate the sounds
Also, Pink Floyd often has mumbling and talking at low levels in the background that always sounded indistinct until I built my planars... especially on Dark Side of the Moon... I recall hearing a woman's voice I think right b4 the "Time" segment...
or maybe I just forgot to take my pills, eh??😉
just some thoughts
John L.
dlr,
Note that the time scale in the first two CSD plots is very different. The second and latter plots step over much if the short time resolution. In any case there are clearly visible changes between the last two plots.
Bud, With regard to Soongc's phase measurements I would just caution that changes in phase at high frequency are incredibly sensitive to timing errors etc. Additionally, ANY phase response can be decomposed into a minimum phase component and an all pass component. If the all pass component is linear phase then it's just a change in delay. In all of soongc's measurements there is a very significant change in phase but no corresponding significant change in the amplitude response. What soongc should have done is show whether the variation phase response could be collapsed to one nominal curve by adjusting the delay. This would imply minimum phase response in all cases. Then it would be possible to identify areas in the response where there should be changes in amplitude corresponding to any change sin phase.
Also I think that thinking in terms of damping standing waves really isn't where it's at. It's about damping reflections at interfaces. This only results in standing waves if the frequency corresponds to a resonant mode of the drivers. Also, this seems only to address transverse waves and no consideration has been given to circumferential modes.
John, thanks for the suggestions. I suspect I'll do a mix of stuff I usually use for evaluation plus stuff my victims choose. Pink Floyd is an interesting choice, but I'm afraid the the presence of lava lamps and bongs could cause uncontrolled reflections.
selections and reflections
Got it...
I've had a few uncontrolled reflections myself, sometimes with wine, sometimes with bourbon, sometimes...
Miles Davis also comes to mind as well as early Weather report... too bad I'm in the bluegrass and not on the left coast... I could be a "victim".. hehe😎
I think you're probably right. But it would seem some of the discussion is about minimizing interfacial reflections to damp any "buildup" of erroneous information (<<= trying to avoid the use of std terms here)... sort of like minimizing VSWR in microwave applications.
John L.
SY said:John, thanks for the suggestions. I suspect I'll do a mix of stuff I usually use for evaluation plus stuff my victims choose. Pink Floyd is an interesting choice, but I'm afraid the the presence of lava lamps and bongs could cause uncontrolled reflections.
Got it...
I've had a few uncontrolled reflections myself, sometimes with wine, sometimes with bourbon, sometimes...
Miles Davis also comes to mind as well as early Weather report... too bad I'm in the bluegrass and not on the left coast... I could be a "victim".. hehe😎
john k said:Also I think that thinking in terms of damping standing waves really isn't where it's at. It's about damping reflections at interfaces. This only results in standing waves if the frequency corresponds to a resonant mode of the drivers. Also, this seems only to address transverse waves and no consideration has been given to circumferential modes.
I think you're probably right. But it would seem some of the discussion is about minimizing interfacial reflections to damp any "buildup" of erroneous information (<<= trying to avoid the use of std terms here)... sort of like minimizing VSWR in microwave applications.
John L.
Re: CSD interpretation
Be very wary of making any inferences from any quasi-anechoic measurements. These are typical, with a low cutoff of 400Hz. There are two issues here. The window was selected, appropriately I believe, to avoid any reflections, a requirement. First, this means that the limits of resolution across the spectrum for display will have a sample point separation of 400Hz. Everything in between is totally missing data, except for the FFT "bin" variations inherent in the processing. It's the effect on the bins by the window (type, start and stop markers) used that will cause some variation.
Second, if the same window were used and a square window rather than what I suspect was a half Blackman-Harris window, the low end frequency response from 400Hz up to maybe 1200Hz might easily show 1-2db variations in FR. These low end variations can easily show up either as false resonance ridges or a leveling of real resonant ridges. Anything below 1K in these two plots are highly questionable as to precision, a normal situation for the short window required to eliminate reflections. It would take something such as a true infinite baffle in an anechoic chamber, a measurement made outdoors with the driver "flush" mounted in the ground and mic above or a ground-plane measurement to truly capture the low end, but it can be done.
That low end is unlikely to be much of the reason for any change in perception IME unless the mass added made a fair amount of change in Fs and/or sensitivity. The ratio between low and high frequency sensitivity can change with added mass that will alter the spectral balance of the driver.
The only way that it might be possible for the software with which I am familiar would be run successive FFTs for FR, then saving each file. That is, run it as normal for the full window length FR response, move the start marker some defined, specific amount of time (x micro-seconds), run the FFT, save the file, then repeat until the start time marker is almost equal to the stop time marker. Tedious and with quite a few files to process.
Note that I've had this sitting to reply for a while, so I've not reviewed some of the more recent posts.
Dave
BudP said:Ah, only 5 dB, but all along the slope, there at 13 to 14 k. Thanks Dave.
Also looks like some changes out in the middle of the window, with missing humps, but, very hard to track the individual lines to be certain.
Bud
Be very wary of making any inferences from any quasi-anechoic measurements. These are typical, with a low cutoff of 400Hz. There are two issues here. The window was selected, appropriately I believe, to avoid any reflections, a requirement. First, this means that the limits of resolution across the spectrum for display will have a sample point separation of 400Hz. Everything in between is totally missing data, except for the FFT "bin" variations inherent in the processing. It's the effect on the bins by the window (type, start and stop markers) used that will cause some variation.
Second, if the same window were used and a square window rather than what I suspect was a half Blackman-Harris window, the low end frequency response from 400Hz up to maybe 1200Hz might easily show 1-2db variations in FR. These low end variations can easily show up either as false resonance ridges or a leveling of real resonant ridges. Anything below 1K in these two plots are highly questionable as to precision, a normal situation for the short window required to eliminate reflections. It would take something such as a true infinite baffle in an anechoic chamber, a measurement made outdoors with the driver "flush" mounted in the ground and mic above or a ground-plane measurement to truly capture the low end, but it can be done.
That low end is unlikely to be much of the reason for any change in perception IME unless the mass added made a fair amount of change in Fs and/or sensitivity. The ratio between low and high frequency sensitivity can change with added mass that will alter the spectral balance of the driver.
auplater said:Can the raw data generating these plots be output into, say csv format? Seems to me we're all looking for difference info here, so it wouldn't talke much to output to csv, feed into excel or your favorite spreadsheet, subtract the (looks like 15 data sets) from each other, then plot the difference info as a delta CSD.
Having manipulated data for many decades, I can see this interpretation as fraught with potential problems, as we have no input as to setup conditions. The delta values may be compromised by all sorts of systematic error, measurement bias, etc., none of which is being presented. It's much easier to draw the wrong conclusions from graphical data representation than the correct ones, imhe.
Not trying to sound negative, just pointing out some gotchas I've run into b4.
John L.
The only way that it might be possible for the software with which I am familiar would be run successive FFTs for FR, then saving each file. That is, run it as normal for the full window length FR response, move the start marker some defined, specific amount of time (x micro-seconds), run the FFT, save the file, then repeat until the start time marker is almost equal to the stop time marker. Tedious and with quite a few files to process.
Note that I've had this sitting to reply for a while, so I've not reviewed some of the more recent posts.
Dave
I would like to make a single comment about subjective testing of this process. I was involved in the informal test at RMAF in Nelson Pass' room. I have always been skeptical about these "magic" processes in audio. I generally assume that a device that has been well engineered and put into production has been well tested and proven, etc. So, anyway, the testers put the different drivers through their paces and during the second listening of the orchestral piece, I thought to mysef, "These guys have ruined a perfectly good Lowther driver. These passages are clearly more distorted with the modified cone." But I kept my mouth shut because I didn't want to hurt the feelings of these poor deluded audiophiles. It turns out that this was a good idea for my own sake because the distorted passages were coming from the unmodified driver. So, what conclusion can be drawn when someone goes into a demonstration with negative expectations, "proves" himself correct, then finds out he was mistaken?
John
P.S. I doubt anything will come from objective testing of these drivers. The results will never be accepted by those who have already made up their minds.
John
P.S. I doubt anything will come from objective testing of these drivers. The results will never be accepted by those who have already made up their minds.
- Status
- Not open for further replies.
- Home
- Loudspeakers
- Multi-Way
- EnABL Processes