The question is why one posts in an open technical forum if not for to communicate with people who don’t know him.
🙂
George
I was sort of wondering that too but couldn't work out how to say it politely. I've been a little uneasy with the way this thread is going.
Member
Joined 2019
George, thank you for the link to RMAA!
I do not agree fully with you. The fact that we communicate here assumes some level of knowledge in the field. It may be not present always, but it is better to assume that it is than to assume that it is not. We have also the short biography data in our profiles, where is clear, for example, that I am a nuclear physics scientist and not an enology expert or a specialist in the field of ancient art. Anyway, I wrote about a "shadow of insult", I said that this is not important and I did not request any moderator's action. 🙂
The question is why one posts in an open technical forum if not for to communicate with people who don’t know him.
I do not agree fully with you. The fact that we communicate here assumes some level of knowledge in the field. It may be not present always, but it is better to assume that it is than to assume that it is not. We have also the short biography data in our profiles, where is clear, for example, that I am a nuclear physics scientist and not an enology expert or a specialist in the field of ancient art. Anyway, I wrote about a "shadow of insult", I said that this is not important and I did not request any moderator's action. 🙂
Member
Joined 2019
The only comment on the Test 5 of Post 48 is Post 49 of super10018, so far. I will wait for more comments to form my answer. But super10018 inspired me to use also my Sennheiser HD 595, one of my luckiest purchases before 10 years or so. I did not expect this level of quality in the price of 250 Euro. I suppose that HD 600 are even better.
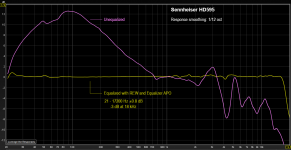
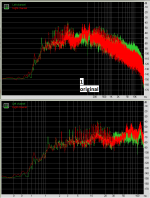
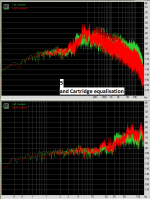
I use my Equalizer APO software to equalize system-widely not only all my loudspeaker sets, but also the headphones. In the first attachment one can compare the original and the corrected response of HD 595. 20 - 17200 Hz ± 0.8 dB is remarkable. But more remarkable is the graph of the THD of the equalized headphones. Values of 2% at 20 Hz and 0.19% at 100 Hz are "a joy for the eyes" as the Greeks say. I did not measure the SPL of these measurements, but it was quite high, within 75 - 80 dB. I used the well priced miniDSP UMIK-1 calibrated measurement microphone.
I use my Equalizer APO software to equalize system-widely not only all my loudspeaker sets, but also the headphones. In the first attachment one can compare the original and the corrected response of HD 595. 20 - 17200 Hz ± 0.8 dB is remarkable. But more remarkable is the graph of the THD of the equalized headphones. Values of 2% at 20 Hz and 0.19% at 100 Hz are "a joy for the eyes" as the Greeks say. I did not measure the SPL of these measurements, but it was quite high, within 75 - 80 dB. I used the well priced miniDSP UMIK-1 calibrated measurement microphone.
Attachments
The talk started in the sub-thread related to removing the very low frequencies. So, I was thinking clearly from this point of view. For me, the modulation group 3000 ± A(k) k 0.55 Hz (where A(k) depend on the eccentricity level) consisted of the frequencies in Hz:
< etc. ... , 2998.90 , 2999.45 , 3000.00 , 3000.55 , 3001.1 , ... etc. >
where I did not see nothing else, although 0.55 Hz is a factor of the modulation.
I hope that using the higher resolution FFT you will be able to observe the effect.
In the same sense I would usually thing of an FM signal of a 100.4 MHz station as a 100.4 MHz signal, and not as a 100.4 Hz ± all the modulated audio frequencies in a 15 kHz range (if mono).
Sorry for the delay in replying to this. My SDR dongle refused to cooperate.
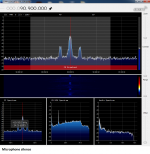
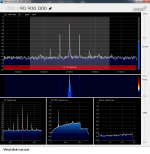
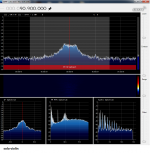
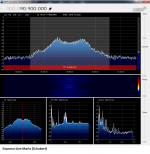
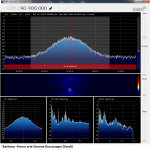
Here is an 90.9MHz FM station (Trito Programma) while transmitting different audio content.
George
Attachments
Member
Joined 2019
I hope that using the higher resolution FFT you will be able to observe the effect.
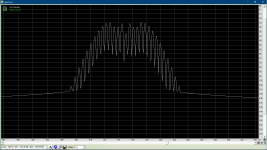
Using the AA signal generator, I created a 315 Hz signal, modulated by 0.55 Hz of 1% level ( = 331/3 LP with eccentricity of 1% ). With 1 M FFT I see exactly what I expected:
1. Instead of a sharp peak at 315 Hz, I see a region of frequencies: 306 - 324 with the intensity varying with the frequency of 0.55 Hz.
2. No trace of 0.55 Hz.
In 1. and 2. I demonstrate again my purist use of the term "frequency". A gentleman wrote me "You are not looking in the correct region". When purist, I look for 0.55 Hz where I see written, in the axis x, "0.55 Hz".
But I think the misunderstanding is over. Greetings.
315 1% ecc 0.55.wav - Google Drive
Attachments
Member
Joined 2019
Romantic memories
In Greece we had a lot of enthusiast's experimental FM broadcasting during the 1970ies. The first state Greek broadcasting started in Athens at 1977. I was 32 years old during this time.
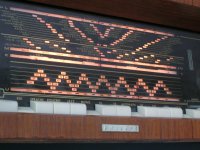
The kind wish of George to remind me that period with some FM signal analysis pictures brought in my mind the earlier AM periods, when the receivers scales were informing of the radio signal 1 period 'length' instead of it's kHz or MHz frequency. I was 10 years old during the mid-fifties and I remember well those nice scales of the solid prestige and large dimensions radios, together with their convincing deep bass sound.
We had the SW bands in "meters", starting from the "13" band and ending to the "49". The frequency band of SW was (and is) roughly 6 - 23 MHz. We had the MW band of 187 - 566 meters or 0.53 - 1.6 Mhz. And we had the LW band of 1060 - 2030 meters, or 0.148 to 0.283 MHz.
I post the image of an excellent Blaupunkt scale of that time, with the nice tilted list of station names - an unforgetable romantic feature. Yes, the green "magic eye" correct adjustment indicator is not here, to complete the Bluepoint romantic memory.. I see an "Athinia" label near 500 m and a "Thessaloniki" label near 375 m. I presume that this is the same frequency of that powerful "Voice of America transmitted from Thessaloniki", which was well received over a wide region of East-South Europe.
Attachments
Last edited:
2. No trace of 0.55 Hz.
But I think the misunderstanding is over. Greetings.
Hi Panayiotis
Why don’t you do an 1M (or higher) FFT on the recording from your measuring disk which has an eccentricity nearly 0.2 mm (as you wrote in post # 25)?
If I understand you correctly, you are only interested in verifying that a frequency component is present at the 0.55Hz point along the frequency axis of an FFT plot.
I post the image of an excellent Blaupunkt scale of that time
Old radios are still with us, part of everyday life
George
Attachments
Member
Joined 2019
Hi Panayiotis
Why don’t you do an 1M (or higher) FFT on the recording from your measuring disk which has an eccentricity nearly 0.2 mm (as you wrote in post # 25)?
If I understand you correctly, you are only interested in verifying that a frequency component is present at the 0.55Hz point along the frequency axis of an FFT plot.
George, let's stop knocking at open doors! I have already done what you propose, with 1M FFT, and I saw what is expected. I did the 'clear' experiment with a single 315 Hz line to see the 'clear' picture. The actual picture is a superposition of thousands of clear pictures over the whole audio spectrum. And the spectrum will be full of those 0.55 Hz patterns, as long as the signal has got some components in all the 20 - 20000 Hz range.
What I was interested in this part of the editing procedure was to remove any frequency not belonging to the original, "master" file. Not specifically the 0.55 Hz one (which is extremely low), nor the cartridge/tonearm resonance, not the suspension oscilation components (about 6 Hz in my case) - just ALL!
Now, when somebody shows me the HR FFT spectrum picture and says "It is full of 0.55 Hz", I say "No, there is no 0.55 Hz there! There are frequences > 30 Hz, modulated by the 0.55 one. A simple proof of this statement is the fact that those patterns do not diminish after the <30 Hz filtering, ergo they are NOT "0.55 Hz frequences". They are frequences
F = Fo + k 0.55 , Hz, where Fo > 30.
I will post later some spectrums from the "real life" of my TTT - the measuring disk surface noise.
Last edited:
Member
Joined 2019
To gpapag
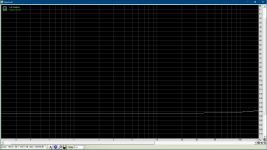
Here is the high FFT analysis of my measuring disk un-modulated groove noise. The original noise and the 30 Hz filtered one.
Meanwhile, I thing to try an inverse modulation of my clear 315 Hz modulated signal. I expect to see a restored 315 Hz, without any 0.55 Hz lace. Just for fun..
Here is the high FFT analysis of my measuring disk un-modulated groove noise. The original noise and the 30 Hz filtered one.
Meanwhile, I thing to try an inverse modulation of my clear 315 Hz modulated signal. I expect to see a restored 315 Hz, without any 0.55 Hz lace. Just for fun..
Attachments
Not if the vinyl is in good condition. As for noise, you don’t hear it when the music is playing. Typical dynamic range on an LP is 60 dB and a CD about 90+ dB. However, on recorded material it’s probably only about 20 dB in real terms.
Anyway, if you don’t like vinyl, why not head over to the digital forum and stop trolling here?
If writing facts is trolling, too bad. And if you dont like facts than you can take your OPINIONs to the lounge forum.
And it definitly gives noise away for free, not to mention ticks and pops, microphonics etc,etc.
Which part of this is not true?
Member
Joined 2019
To cbdb and Bonsai
I am not supporting the view "A good Vynil sounds better than a good CD". Here is an old clip with my opinions and some measurements.
YouTube
On the other side, I am deeply interested to find why a lot of people find the vynil sound more pleasing, natural, soft, mild etc. I suspect that one of the reasons may be the fact that the "Golden 80ies", when a lot of very nice music was composed, played and recorded, were actually "analog years". The first CDs were available in the late 1982, but only in 1988 the CD sales surpased the vinyl ones in USA. And yes, I remember the child problems of CD..
Last edited:
Member
Joined 2019
A question for cbdb.
Years before the introduction of CD, during the 70ies, there were more and more LPs made from digital master recordings. What were the parameters of those digital recordings?
Years before the introduction of CD, during the 70ies, there were more and more LPs made from digital master recordings. What were the parameters of those digital recordings?
Editing of digitized vinyl music - Pros and Cons
These are the main editable / correctable types of added sounds. We can mention also some additions that can not be corrected digitally:
a. The wow caused by the eccentricity of the disk grooves with respect to the axis of rotation. This can be minimized by careful disk centering.
b. The harmonic distortion components added by the cartridge. Not editable digitally. The only cure is a higher quality cartridge.
c. The harmonic distortion added by incorrect tracking geometry (tonearm length, tracking angles). Not editable digitally, but minimizable through careful tonearm/cartridge adjustments.
After listing of all the above negative addons, I will discuss in more details the editable ones and the methods of editing. I think to do it post-by-post and with no hurry .. 🙂
Meanwhile, please feel free to add any note / opinion / comment, not necessarily related to what I have posted.
Thank you.
Hi
There is one additional effect of recording Vinyl Records that has not been mentioned, unless I missed it when reading through the thread.
Acoustic feedback of the record deck can make a fundamental difference to the quality of the recording. When the record is to be digitised the volume of the system should be kept low or preferably off. This makes a big difference especially if the turntable or its support is less than ideal.
Member
Joined 2019
Hi
There is one additional effect of recording Vinyl Records that has not been mentioned, unless I missed it when reading through the thread.
Acoustic feedback of the record deck can make a fundamental difference to the quality of the recording. When the record is to be digitised the volume of the system should be kept low or preferably off. This makes a big difference especially if the turntable or its support is less than ideal.
I fully agree with you. Now, when this problem is mentioned, I can list my preferred solutions:
1. Listening with headphones, the speakers system totally off. This allows to have a detailed idea of the recorded sound properties, but requires your being in one place for 2 x 20 minutes. Well, a Bluetooth headphones version makes you much more mobile.
2. Listening to the sound through loudspeakers, but in quite low volume and with a modified frequency response. I use a special frequency correction of my Equalizer APO system-wide corrector, named "LP Recording". It is flat within 1k - 20k, then gradually goes down to - 40 dB from 1000 to 500 Hz and stays constant at -40 dB in the rest of the audio spectrum - 500 - 20 Hz.
This gives a good idea of the high frequency part of the recorded sound and allows to have practically no feedback problem even with the right speaker as close as 60 cm to the disk center - this is my case. I say this not based just on listening tests. I have compared in details the recordings with the speakers ON and OFF.
Greetings.
Last edited:
After a suggestion of billshurv, I post Test 5
The FLAC file:
Jazz Trio Leonid Chizhik All 5.flac - Google Drive
With this music, listening through headphones, I like the final outcome of your process.
George
Attachments
Hi,
At some time in the near future I shall be able to digitise my vinyl collection, and have been following this thread with interest. It is my intention to set up the turntable and phono ADC and to record as FLAC’s at the highest possible resolution. I think it entirely possible to enjoy vinyl with all the snap, crackle and pops and other artefacts without too much distraction.
Methinks it also takes quite awhile to really master the post production techniques involved here, and feel that for now, it is quite enough as it is to get the very best possible raw data out of the grooves.
Just stating the obvious, as I always do. ToS
Last edited:
A question for cbdb.
Years before the introduction of CD, during the 70ies, there were more and more LPs made from digital master recordings. What were the parameters of those digital recordings?
Digital recording didnt really start till the early 80's, from wikipedia
Prior to the 1980s, most recording studios used analog multitrack recorders ...
Popular professional digital multitrack recorders produced by Sony/Studer (DASH) and Mitsubishi (ProDigi) in the early 1980s helped to bring about digital recording's acceptance by the major record companies. The 1982 introduction of the CD popularized digital audio with consumers.
And they werent cheap, the mitzi 32track was around $250k!
Not sure what you mean by parameters, sample rate, bit depth?
- Status
- Not open for further replies.
- Home
- Source & Line
- Analogue Source
- Editing of digitized vinyl music - Pros and Cons
