Absolutely could be.
I chose to use ARTA because come of our professional members use it. It's clunky to use, and has a problem then. Never mind it's expense!
-Chris
I chose to use ARTA because come of our professional members use it. It's clunky to use, and has a problem then. Never mind it's expense!
-Chris
I would file a bug report and it will get fixed in time. Updates are free once you have the license.
I will stop using the Kaiser 7 window in Arta.. If the wicki is working at all it might be useful to make specific recommendations for windows to use for specific purposes and which windows correlate well with conventional test equipment.
I will stop using the Kaiser 7 window in Arta.. If the wicki is working at all it might be useful to make specific recommendations for windows to use for specific purposes and which windows correlate well with conventional test equipment.
Thanks everyone for all discussion on window types and application. There does seem to be a common trend on when to apply them although the theoretical explanation might be too mathematical to understand. Perhaps someone would like to sort it out into the wiki page? I could not find it because I don’t remember which directory it is in.
Just search the WIKI for "RTX6001" 🙂
The WIKI page is here: Tutorial: How to use the RTX6001 audio analyzer in real world audio tests
I don't know what "standards" are out there with respect to window functions and their use in different applications. The properties of different window functions are a signal processing subject and not at all specific to the RTX6001. I guess it's up to the users to make sure they understand what their software is doing to the data.
Okay, so it’s under “system”.
I am wondering, does anyone do the distortion sweeps?
Yes, I sometimes do. Why?
I chose to use ARTA because come of our professional members use it. It's clunky to use, and has a problem then. Never mind it's expense!
Chris, I guess you bought ARTA. I'd say the makers of ARTA owe you to fix it if it's broken. Tell them about it, and ask them to fix it.
I've never heard of an FFT window setting of Kaiser7 before, and I was suspicious of the exceedingly low distortion numbers I was getting using it. My normal setting for an FFT analyser is the old Hanning window. That one I know returns accurate answers, or at least answers that agree with other methods of getting a number for harmonic distortion.
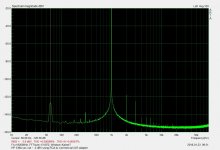
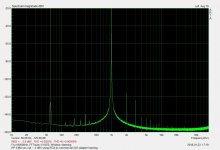
Here are a pair of screens showing both windowing selections on my HP 339A distortion analyser. Which of these do you believe is correct?
-Chris
Both the graphs are showing essentially the same signal with the same distortion. Not the analysis, the graphs.
They show equivalently that the level of harmonics is attenuated at around -120 dB with respect to the 0dB reference level.
With respect to the signal fundamental carrier this converts to -116dB.
(0.00016%)
From these numbers it is clear that the poster had committed some fundamental errors.
First, the software had been set to show harmonics levels with respect to a pre-set reference level, and not the rms value of the fundamental.
So he erroneously gets -120dB dist. att. equivalent (0.0001%)
With the correct software setting he would have got the right value (0.00016%)
Now, the distortion attenuation level given in dB for 0.0001% is -120dB
The equivalent dist. attenuation level for .0022% for 0.0022% is -92dB
Given that in the obtained graphs the harmoncs level does not get anywhere near to this completely insane value, the right conclusion can not be else that the calculated 0.0022% is totally wrong.
So the second graph with the hanning or Hann window setting gives a totally false value in the analysis.
If this value is in agreement with the output of the experimenter's other, outdated instrumentation - than sorry but those results are false, not correct for this generator too.
The measurement with Kaiser 7 window set had provided a correct result, once compensated for user error.
Ciao, George
Attachments
Last edited:
Hi George,
Are you at all familiar with how ARTA works by chance?
The THD obtained with the Hann window does in fact agree with my sorely outdated equipment and I apologize for attempting to continue to use the accepted results that the entire world has agreed upon. Not to mention that the outdated equipment is a Hewlett Packard 339A distortion measuring set. The amount of distortion for this oscillator type has been seen to average 0.0018% THD+Noise for most unmodified instruments of this type.
I'm always willing to learn, please teach me what settings to use in ARTA and I will post the results.
Best, Chris
Chris,
Manual page 27, Figure 2.3.
Control that the 'Normalize with full power' box is checked.
Ciao, George
Manual page 27, Figure 2.3.
Control that the 'Normalize with full power' box is checked.
Ciao, George
Also it was already mentioned that according to the ARTA manual the distortion measurements should be done with Kaiser 7 windowing.
The above sanity check calculation had shown that indeed the Kaiser window setting returns the right results.
The fact is that your's new toy (RTX6001) shows black and white that your 'old' HP339 generator is an order of magnitude better performing than the outdated analyser sections had shown to You for ages.
I think You should be rather happy with this fact than shoot the messenger bringing You this surprising news.. 🙂
Ciao, George
Hi George,
It's not that I'm shooting the messenger. I am very suspicious of something that shows such different information. Even my HP 3585A and 4195A agree with what is shown on the meters of distortion analysers. I was taught (a long time ago) in class at Ryerson here in Toronto that the Hann window was to be used for measurements such as THD and THD + Noise. Everything in my world was in agreement until this new "toy" arrived along with a new windowing selection I had never before seen before.
These numbers are generated with the aid of averaging a large number of FFT results that allow us to "see" beneath the noise floor. These results would have us believe that the A/D converters used in the RTX 6001 are performing well beyond their own specifications. That should really ring some alarm bells for you.
I would be delighted if this were to be the true performance of the oscillator section in the HP 339A. It performs so much better than the folks at Hewlett Packard rated it for. I would think they know a thing or two about measurements and statistics. Their new U8903B doesn't even perform this well if I am to believe what I'm being told.
I'm not trying to be pessimistic here, but rather realistic. I am not disappointed with the higher distortion readings because I had accepted those as being normal for this equipment.
Over a period of 30+ years, my THD readings have agreed with those from various audio equipment manufacturers who use an entire range of distortion analysers, even including the Panasonic and others substantially better than the HP 339A. When I worked in a calibration laboratory (for electronic instruments), calibration on those distortion measuring assets did agree with what I am use to seeing. The same holds true for the various oscillators that ran across my bench.
I have many long years of experience that is at odds with what the ARTA software is showing for distortion. In order to accept these new readings, I need to be able to explain the new readings and why they are so different from long experience.
As for the numbers returned by ARTA, those are internally calculated and there isn't anything I can do to change them after ARTA has calculated those values. I think that ARTA has errors in programming, and I am surprised that after so many revs., these errors still exist in the program.
I do value your input George, and I am hopeful that you can shed some light on these issues. I'm not disagreeing with you for the sake of a good argument, I am trying to figure out how your method and numbers can differ so far from the ones I am used to seeing.
Best, Chris
....the software had been set to show harmonics levels with respect to a pre-set reference level, and not the rms value of the fundamental.
anatech, can you show your graphs showing the full peak of the fundamental? That might help to understand what's going on.
Chris,
If you do the math on the very same measurement shown by yourself, then you must conclude in agreement with 'us', ARTA and me.
Independently from windowing etc.
You can not show a graph with -116 dB ; -115dB harmonic content and say that is is equivalent to 0.0022%. It is equivalent to < 0.0002 %.
If it is not satisfying.. then plese repeat the test until it results with spurie reaching up 20dB higher.. then I will start to believe in what the other tests say.
I hope You remember that I own the same analyzer. (3585A ). So I can confirm that it is totally inadequate for this kind of testing..
The error is not with the modern tools and methods..
anatech, can you show your graphs showing the full peak of the fundamental? That might help to understand what's going on.
It is written in the analysis section, -3.9dbV...
I know from experience that ARTA does not lie about it, if it is written like that then it will also show up like that..
Ciao, George
Hi mbrennwa,
I was just about to say that the level is printed on the graph already.
Hi George,
Do you have any idea how long it has been since I calculated THD by using each harmonic? 😀 Really, it's been so long that I'll look up how to do it properly.
No, I didn't know you also have an HP 3585A. It's good to know that these have migrated into the hands of people who really need them instead of being scrapped. The thought of good test instruments being destroyed upsets me. It is so difficult for us to obtain instruments that we need to progress in this work. If I were rich, I'd probably still buy the equipment used!
Question for you. Assuming that you are correct about the distortion numbers, why would HP / Agilent / Keysight and everyone else quote distortion numbers that were so far below the level that their equipment does attain? They could have used the lower numbers for the oscillator distortion of the 339A, or any other instrument they made, and simply state that the performance cannot be measured using the simple analysers (like the 339A). They could have easily specified a new spectrum analyser than the 3585A and the manual method to calculate this figure. I know the 35385A will do this, but I forgot how it's been so long. Time to pull out the manual and read it again.
Another question. You seem to be very familiar with ARTA. I've had it a few weeks now with very little time to work with it, so I'm like the guy who just got it. The lower number given by the noise + THD is a great deal lower than the straight THD number. Is there something I am doing wrong (I don't see how this is possible), or is it something that the ARTA team needs to correct? From my standpoint, that value is in error, and not by a little bit either.
Thank you, Chris
The quoted specs of the 339A are for the whole audio range ... maybe your results will get worse if you move to the boundaries.
The quoted specs of the 339A are for the whole audio range ... maybe your results will get worse if you move to the boundaries.
Also, I would be cautious not to mix pure THD results with THD+N. With analog instrumentation always the whole distortion residual got converted including the noise. That is, numbers were THD +N. For this it was important to define also the measurement bandwith. (Integration period for the noise)
With these FFT spectrum calculations only the pure nonlinearity harmonics are taken care of. Cleaner numbers, referring to the DUT nonlinear behaviour.
What regards that strange measurement - no, I do not have a clear idea. We have seen that the Hann windowing gives a less tight filtering effect. That is, more noise energy can get into / under the much broader skirts around the fundamental and harmonics. The generator produces a lot of noise around the fundamental; I suppose this is the decisive element for the strange results..
With a much more stable (digital) generator I suspect the results would be much closer for the different window functions..
Ciao, George
It is written in the analysis section, -3.9dbV...
Argh, ok, thanks for pointing this out to me.
Reading the peak heights off the graph (they are not that different between the Hann and the Kaiser plot), and comparing them to the level of the fundamental (-3.9 dB):
The second harmonic is down by about -115 dB relative to the fundamental, or about 1.8 ppm of the fundamental.
The third harmonic is down by about -119 dB relative to the fundamental, or about 1.1 ppm of the fundamental.
Estimating the THD from the 2nd and 3rd harmonic only, I get THD = sqrt(1.8^2 + 1.1^2) ppm = 2.1 ppm. Including all harmonics would not bring this value up by much, because the higher harmonics are lower than the 2nd and 3rd by at least one order of magnitude (note the geometric summation). I'd therefore expect ARTA to give a THD value close to 2.1 ppm, or 0.00021%.
In the measurement with the Kaiser window, ARTA says THD = 0.0022%, which is an order of magnitude too high. In the Hann measurement, ARTA says THD 0.000096%, which is too low by a factor of 2.2. The ARTA THD numbers don't look right to me. Then again I have never used ARTA, and I have no clue how it works. I'd double check the ARTA settings, RTFM, and then ask the ARTA guys about it.
Last edited:
If You consider the spurius levels referred to 0dBV, and not to the actual fundamental, then you get the ~~ equivalent of the number shown by Arta..
That is, ~-120 dB second harmonic, not -115.
This is why I suspect and suggested to control if the 'normalization to fundamental level' bit is set..
I got burned by this several times.
All analysis software has this possibility and always should be controlled.
Also, in my case I had controlled on several occasions that ARTA and other quality software packs are eventually responding with very close numbers, if everything is correctly set up and used.
The best would be e repeated test with these settings in place.
Ciao, George
- Home
- Design & Build
- Equipment & Tools
- DIY Audio Analyzer with AK5397/AK5394A and AK4490