You can experiment with the VituixCAD. Change the crossover frequency to higher or lower and see what happens to the DI. Play with the delay and xo slopes. You could attach the whole sixpack at some point as well 🙂
Sheeple, I downloaded your data in post #55. The measurements have extra delay which could be removed with gating I think. Also near field measurement of the woofer (and port?) are not included in the data set.
Anyway, loaded the files into VituixCAD and they seemed to adjust fine. I don't know if the measurements match reality but at least I was able to massage the filters so that things look nice.
Few tips:
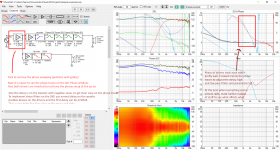
1. Get rid of the extra delay in the measurement data by having global (negative) delay block at first. I adjusted it so that the extra phase wrapping was out, some 3ms was needed in this case.
2. Phase was still wrapping once at the crossover reqion so flipped both driver polarities to get the wrap out from the xo zone.
3. The woofer needed delay, but I got nicer look at the phase traces by using negative delay on the horn instead.
With all these tricks there is now nice look at the phase traces around the crossover point. On the DSP you would not need the first delay block, or flip the phases on the drivers and could use normal delay on the woofer (instead of cheating physics with the tweeter) and everything would be pretty much the same as in the simulation with the tricks.
Now that there is clear view on the GD & phase window I just massage the filters and delays looking mostly at the phase traces. Moving the low and high pass frequencies and slopes. Adding some parametric EQ:s to the knee area I got the phases match pretty well around the crossover. The end result is pretty good listening window, power and DI. I have no idea what the slopes are and what the actual crossover frequency is, but who cares. Just massage and rub the parameters and the puzzle pieces fall in place 😀 There isn't other rules than use only filters that are available in the DSP. Hope it helps. Now that you have one kind of working baseline setup you can experiment with other slopes or tweak it further and compare the sound to this if it is any better.
If anyone spots errors here that don't translate to real world please come forward since I want to learn as well.
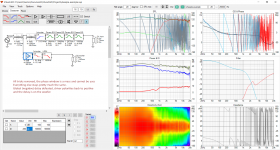
Attached Zip contains the VituixCAD project file and screenshot with some legend to double up the text. The second image is showing all the phase window clarification tricks defeated. Response is pretty much the same but the phase window is unreadable.
edit: the Y coordinates of drivers were pulled out from air, you should use what ever the measurement method and listening axis dictate. More info on VituixCAD manual. It has been a long time since I red it and don't remember much.
Anyway, loaded the files into VituixCAD and they seemed to adjust fine. I don't know if the measurements match reality but at least I was able to massage the filters so that things look nice.
Few tips:
1. Get rid of the extra delay in the measurement data by having global (negative) delay block at first. I adjusted it so that the extra phase wrapping was out, some 3ms was needed in this case.
2. Phase was still wrapping once at the crossover reqion so flipped both driver polarities to get the wrap out from the xo zone.
3. The woofer needed delay, but I got nicer look at the phase traces by using negative delay on the horn instead.
With all these tricks there is now nice look at the phase traces around the crossover point. On the DSP you would not need the first delay block, or flip the phases on the drivers and could use normal delay on the woofer (instead of cheating physics with the tweeter) and everything would be pretty much the same as in the simulation with the tricks.
Now that there is clear view on the GD & phase window I just massage the filters and delays looking mostly at the phase traces. Moving the low and high pass frequencies and slopes. Adding some parametric EQ:s to the knee area I got the phases match pretty well around the crossover. The end result is pretty good listening window, power and DI. I have no idea what the slopes are and what the actual crossover frequency is, but who cares. Just massage and rub the parameters and the puzzle pieces fall in place 😀 There isn't other rules than use only filters that are available in the DSP. Hope it helps. Now that you have one kind of working baseline setup you can experiment with other slopes or tweak it further and compare the sound to this if it is any better.
If anyone spots errors here that don't translate to real world please come forward since I want to learn as well.
Attached Zip contains the VituixCAD project file and screenshot with some legend to double up the text. The second image is showing all the phase window clarification tricks defeated. Response is pretty much the same but the phase window is unreadable.
edit: the Y coordinates of drivers were pulled out from air, you should use what ever the measurement method and listening axis dictate. More info on VituixCAD manual. It has been a long time since I red it and don't remember much.
Attachments
Last edited:
Given that we are using such technical terms as humps and bumps it is understandable that confusion could result 🙂I understand this as an issue how horizontal and vertical axes are weighted. Because even with de DI hump in total ERDI and ER, if we only look at horizontal directivity of a 12-Inch woofer crossed to an even sized 90 degree waveguide, this combination shows great performance. Have a look at my post #60 where the horizontal directivity and and ERDI are plotted together with overall DI and ER. The issue Kimmo tries to solve is vertical DI. And now I would really love to learn more about his arguments, because I am not so sure about the causes of the 'DI hump' in my case.
Your post 60 is what I would call a hump, the directivity rises quickly before it flatlines. The directivity matches at the crossover but then it drops off more quickly as the woofer takes over. This is hard to avoid with a woofer waveguide combination but by having them less matched at a single point can smooth that transition instead of pronouncing it.
A bump to me happens over a smaller frequency range like the power response dip and associated DI "bump" that would occur in a textbook LR crossover.
In the data that tmuikku showed you can see that the crossover is not textbook LR but the result is pretty good.
How are you measuring? Are you using a dual channel setup or some other form of time locking?
Having delay in the measurement makes me think you are not.
tmuikku,
thank you. When I exported the polar measurements from REW, I thought they would come gated as they where in REW, but I already saw they did not. Until now, I have not found the checker to click that says 'export gated'. As you see I still lack basic literacy in the possibilities of vCAD, very good trick. I also love how good your high pass at 21 kHz works out! 🙂 I could not find the current near field, after I return from the weekend and be back, I will make one new. I will probably not read much during the weekend, but attached is my reply as a .vpx file. It contains your setup, R2 is the actual crossover in HPX that is running the speaker now and there is R3 which tries to mimick the actual measured response to have a more realistic idea of actual ER and DI. You see that R2 behaves not like the measured response. Two things: It uses filters that where done with woofer near field measurement (plus some later shaping in the crossover region). Second, and Kimmo knows about this limit as he wrote about it over at ASR, the loading of the waveguide is something which VCD does not model correctly. This explains the mismatch in simulated HF response.
I will leave current REW data collected far field, 1 m distance, 1,37 cm from the floor, measuring axis 0 deg ver/hor between woofer and compression driver, this is R2. For proof I am not a mad man https://mega.nz/file/VBxAnCQR#QSUzWfMQrguya1367AogUAk8VbQ0_kM17_jiRCLJQJE
Note in both R2 and R3 I removed polarity inversion and changed global delay to 1 m/2,91ms, so to see phase coherence at actual crossover frequency. Maybe I did not understand your trick correctly, but wanted to put phase where it is atm.
thank you. When I exported the polar measurements from REW, I thought they would come gated as they where in REW, but I already saw they did not. Until now, I have not found the checker to click that says 'export gated'. As you see I still lack basic literacy in the possibilities of vCAD, very good trick. I also love how good your high pass at 21 kHz works out! 🙂 I could not find the current near field, after I return from the weekend and be back, I will make one new. I will probably not read much during the weekend, but attached is my reply as a .vpx file. It contains your setup, R2 is the actual crossover in HPX that is running the speaker now and there is R3 which tries to mimick the actual measured response to have a more realistic idea of actual ER and DI. You see that R2 behaves not like the measured response. Two things: It uses filters that where done with woofer near field measurement (plus some later shaping in the crossover region). Second, and Kimmo knows about this limit as he wrote about it over at ASR, the loading of the waveguide is something which VCD does not model correctly. This explains the mismatch in simulated HF response.
I will leave current REW data collected far field, 1 m distance, 1,37 cm from the floor, measuring axis 0 deg ver/hor between woofer and compression driver, this is R2. For proof I am not a mad man
https://mega.nz/file/VBxAnCQR#QSUzWfMQrguya1367AogUAk8VbQ0_kM17_jiRCLJQJENote in both R2 and R3 I removed polarity inversion and changed global delay to 1 m/2,91ms, so to see phase coherence at actual crossover frequency. Maybe I did not understand your trick correctly, but wanted to put phase where it is atm.
Absolutely!Given that we are using such technical terms as humps and bumps it is understandable that confusion could result 🙂
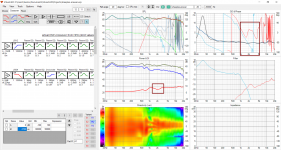
Let us forget the response from #60 because it was not a textbook LR4 crossover. Within the ability of the compression driver, this is achieved in the current settings as seen in this image (how do you actually insert them the way that they enlarge when clicked?):Your post 60 is what I would call a hump, the directivity rises quickly before it flatlines. The directivity matches at the crossover but then it drops off more quickly as the woofer takes over. This is hard to avoid with a woofer waveguide combination but by having them less matched at a single point can smooth that transition instead of pronouncing it

What can be said about this reponse in relation to directivity?
1) Between 1.5 and 2.5 kHz there is a widening of directivity. This is caused by the waveguide as seen here:
The weak response there is a property of the waveguide H6512, and when EQed for flat on-axis response, one gets a widening of directivity off-axis as is to be expected. There is more to this waveguide, like the resonance at 6.8 kHz (and harmonics) which results from the screw-on adapter of 2.5 cm/1 inch diameter, but let us stay away from this for now.
2) The woofer has an uneven response behind the crossover region, perhaps only because of sub par measurement skills, maybe port cancellation above 1st port resonance (=608 Hz), and so it looks a bit uneven and may peak more than in reality at 1 kHz if it is only a measurement problem. Also to be observed in the source data:
1) cannot be changed other than changing the waveguide (see my WTB in the signature, I am considering it), the rest we will see another day with better data.
Now lets see what can be done using a part of Kimmos formula, spacing. With XO at 1.25 kHz, 1.2 lambda is 33 cm, the current C-C distance has them 26.5 cm appart, so dial in -6.5cm to the y-axis of the woofer and you get this:

Smoothens the transition out a bit. It is actually the optimum, no other distance is equally good for ER, SP, DI, Kimmo seems to know what he says. Anyway, let us not forget horizontal directivity as represented in ERDI horizontal, it is great.
I use a focusrite 2i2, loopback, ECM8000 calibrated, bought second hand so might be bad, but I don't think so. I did not estimate+shift IR response, should I do this? Last time I had issues with acoustic offset Allen asked me if I removed it, which I did, so after that I did not remove it anymore to keep the information in the data. If I can read somewhere the very correct procedure, also how to export gated and so on, I am happy to learn.How are you measuring? Are you using a dual channel setup or some other form of time locking?
Regards
Easier said than done, now.tmuikku,
thank you.
... but attached is my reply as a .vpx file.
Attachments
Yeah you can do it the way you want or the way the system wants, either could be better. Start with what the system wants and then tweak it better like you want and it should be winner. Tried the project, the driver phases diverge right above the XO and it shows in the DI. Revisit your filters and try to make the phases track here a bit better and you'll see the DI flattens right out. The waveguide is losing pattern control between 2-3k on the vertical axis, where the 12" woofer has already pretty narrow beam so it is never going to match perfectly. Find a suitable compromise and call it finished. Remember to listen a lot, have fun!🙂
Attachments
Last edited:
I couldn't get rid of the phase kink in the tweeter response in your project despite the same data than in my example. I don't know why, but instead using the "global negative delay" block I inserted the delay in the drivers -tab and the kinks is gone. Maybe there is a bug in VituixCAD, or I just didn't spot what is the difference between the project files. Anyway, seems better way to get rid of the extra delay in measurements in this way. Put the same delay on both drivers, assuming both were measured the same way and measurements have proper timing information included and not hampered by REW.
Attachments

Last edited:
I assume the phase change is a property of the waveguide or it's combination with CDX1-1747. You can probably throw some filters at it to fight physics of the waveguide to questionable success. There is probably a way to validate this? Criterion 4 cannot be matched then.
I assume the limit is simply the waveguide and it's loading issue between 1.5 and 2.5.1) Tweeter (wave guide) much less directive at XO than woofer.
2) c-c distance ca. 1.2 x wave length at XO.
3) Box shape to decrease directivity at XO and increase directivity octave above XO (smoothly with diffraction without sharp edges).
4) Phase match octave above XO and possibly clear mismatch octave below XO.
I did not estimate+shift IR response, should I do this? Last time I had issues with acoustic offset Allen asked me if I removed it, which I did, so after that I did not remove it anymore to keep the information in the data. If I can read somewhere the very correct procedure, also how to export gated and so on, I am happy to learn.
To export gated you just tick the Apply IR Window checkbox
The overall time of flight delay needs to be removed, estimating the IR delay can be a bit hit and miss. If you choose the offset t=0 otion you can move it backwards and forwards and see what happens to the phase at high frequencies. It should trend down to zero or somewhere else depending on the overall phase shift from the crossover filters. If any delay is removed it needs to be the exact same amount to all measurements to ensure the relative phase information between them.
Holm impulse does a good job of this with it's time lock feature but the program itself is not as user friendly or pretty to look at as REW.
Attachments

The phase hump is in your vituix project file but not in mine despite both use same measurements (on my computer). Both project files and the measurements are available in this thread. Managed to get rid of the phase hump by changing settings so it seemed like a bug somewhere. But it might be my user fault as well 🙂 Which VituixCAD version you are using, the latest?I assume the phase change is a property of the waveguide or it's combination with CDX1-1747. You can probably throw some filters at it to fight physics of the waveguide to questionable success. There is probably a way to validate this?
Thanks fluid for the exporting explanation. I would want to simply remove the physical meter (1 m) that the microphone is from the front baffle. I'll try to do that next time.
tmuikku: I found out today that the "phase bump" results from my smoothing settings. To not distract myself with inaudible variation in the HF, I use 1/6-octave smoothing from time to time and forget to set it back to 1/24th. The higher the smoothing ratio, the farther it reaches down until it eventually affects phase at the xo frequency.
tmuikku: I found out today that the "phase bump" results from my smoothing settings. To not distract myself with inaudible variation in the HF, I use 1/6-octave smoothing from time to time and forget to set it back to 1/24th. The higher the smoothing ratio, the farther it reaches down until it eventually affects phase at the xo frequency.
Some outlook for this project:
- I will change the plans for the cabinet and go for removable front baffle and backpanel. This is so because it will take longer to fully optimize the 2-way setup, and as the digital crossover is not a limiting factor, I can further improve it when knowledge is greater. The most important factor is the still unsolved issue of waveguide-to-woofer distance, in relation to the radiator's pattern. If I understood Kimmos remarks correctly, they were stated with classical direct radiator 2-ways in mind. In this case, as he noted, the directivity of the HF-section is in many cases easily considerably wider than the woofer's. At the moment, I have an asymmetric waveguide in use and it is hard to relate his insight to this application scenario, at least I am unsure what it means. Lacking hard knowledge, only experimentation could help. If someone wants to contribute, a collection of ver/hor polars of other waveguides could very much help.
- Let me formulate the unknown factor more precisely: On the horizontal axis, the Dayton H6512 waveguide features the same directivity as the woofer, while it looses pattern control already way above crossover frequency for the vertical angles. Now I could understand Kimmo as in: This is beneficial for a smooth Directivity Index/ERDI ?!? Following the logic that the radiation pattern here is wider for HF-section than for the woofer, albeit randomly with inconsistencies all over the place. If this were correct, a waveguide with pattern authority further down the frequency range would not necessarily help with the rugged Directivity Index. Also, a very wide pattern (like 100 x 100 degrees) could actually be preferable, which is a pretty different concept than what is pursued in many, also commercial, 2-way HF-waveguide speakers that usually constrain the vertical radiation. To understand this, it would be very helpful to obtain a quality set of hor/ver polars for other waveguides as well, like the QSC/B52, axisymmetric OS, or other M2-style waveguides as in Ath4 project. Then, we could try see what happens under different driver spacing. My secret crush is PT-H95HF-1 atm, but it is a bit expansive without knowledge how pattern does affect DI.
- There is other reasons to go for a removable front baffle: The Dayton H6512 features a 1" screw-on adapter which introduces a strong resonance at 6880 Hz (λ/2) and I assume that the following resonances are also a result ore amplified. I do not know if this is a realistic issue, I am showing a CSD-plot with a wide 30 dB range. This is a wider range than most graphs we see. A better waveguide or at least one without duct resonance seems to be a reasonable update at some time. What do you think this :

This is what we normally see (20 dB):

- The loading deficit of the H6512 between 1.5 kHz and 3 kHz cannot be solved with equalization. If equalized flat on-axis, excessive energy off-axis shows up as a broad peak in that region. This makes the transition between compression driver and woofer look as if there was a dip, while there is in fact just the common step of this design, followed by a peak which is waveguide related. My current take is to sacrifice some on-axis response with little compromise to listening window and tame this issue until at a later time a replacement is found/produced. Here are some plots with possible performance, simulated in VituixCAD. To tackle what this actually means, this can be compared to forum member bmc0's competent OS-waveguide 2-way here, or smaller JBL 708p here, DIYSG HTM-12 here, small JBL 4309 here. The best typical response for this sort of 2-way seems to be two level lines with some transitory zone, as in bmc0's speaker. I would like to understand what this means for sound reproduction. This set of images compares the equalization of the waveguide issue:
_without.png")
_with_corr.png")
- This is the 1.2 lambda driver spacing response which is attainable, compromized as it is. The drivers are simulated to be 33 cm appart, center-to-center. Note that the slope (PIR, ER, SP) might actually be more shallow in the upper frequencies. VituixCAD, despite having a pracitcal set of measurements here, cannot take account for the physical properties of the waveguide. It may load differently and not react to equalization as simulated. High frequency energy might be ,ore powerfull and pattern different than what vCD assumes. The woofer response is still rough, because the data was not gated (see some posts above).


- My second prototype speaker (stereo, finally!!! 🙂) should help to solve the question: Is a 1.2 lambda driver spacing good acoustically, does it introduce issues with point source/driver integration and shallow lobing? This is what the baffle looks like if I'd keep the front facing port:

Some cutting on both the waveguide and port termination would be needed, as can be seen from my illustration. Given they are cheap, this is an option for the final speaker, the front baffle of which I want to paint in a lighter color, including port and waveguide, to blend it with the room. One advice I am looking out for is: a) Can I shift the port to the rear if the backpanel if I have about 40 cm space to the next wall behind without getting too much bass gain? b) Would a position on the speaker side panels be prefered if there is more space given the distance stated above? This is a lesser option for me because the port would not sit on a removable baffle and be permanent. c) Is there another benefit other than speaker positioning why manufacturers like JBL for this sort of bigger speakers often put the port to the front? In PA use, meaning outside/not in a room, I mean to remember that front facing ports help with low frequency SPL at the audience. This is not an issue with home application, is there another good reason?
Thanks fluid for the exporting explanation. I would want to simply remove the physical meter (1 m) that the microphone is from the front baffle. I'll try to do that next time.
Here are a couple of articles that might be useful
Phase Response & Receive Delay - ProSoundWeb
A Meaningful Loudspeaker Phase Response - Page 3 of 7 - ProSoundWeb
The M2's pattern from memory is 120H by 100V which is supposed to match the 15" woofer the best at their chosen crossover point.
disagreements
So I have build the second speaker prototype. The port is on the back and a straight tubing is used. The driver center-to-center distance is 1.2 lambda at 1250 Hz (33 cm), which I gently missed with the current configuration with an acoustic crossover at 1200 Hz, but that is okay for now, just a minor note. I can tell that the stereo image is really enjoyable, especially if the speakers are positioned further into the room, away from front wall. If they are closer to a boundary, any head movement introduces an image shift, which is kind of irritating and this effect vanishes completely when pulled away from a boundary. Some toe-in of ~ 20 degrees is also beneficial in my listening room (5.5 by 4.5 meters).
Now I did controll the settings with measurements to see what needs to be adjusted and I still face the same disagreement between near field and far field measurements as before. I trust my measurement rig and ckecked for any errors. But I cannot tell which measurement, or to what frequency, is correct:

The black colored near field measurement is the same DSP settings as the blue colored far field measurment. The far field is gated to 4,2 ms and this is good to exclude any relevant reflexions. Can somebody help me to solve this disagreement?
So I have build the second speaker prototype. The port is on the back and a straight tubing is used. The driver center-to-center distance is 1.2 lambda at 1250 Hz (33 cm), which I gently missed with the current configuration with an acoustic crossover at 1200 Hz, but that is okay for now, just a minor note. I can tell that the stereo image is really enjoyable, especially if the speakers are positioned further into the room, away from front wall. If they are closer to a boundary, any head movement introduces an image shift, which is kind of irritating and this effect vanishes completely when pulled away from a boundary. Some toe-in of ~ 20 degrees is also beneficial in my listening room (5.5 by 4.5 meters).
Now I did controll the settings with measurements to see what needs to be adjusted and I still face the same disagreement between near field and far field measurements as before. I trust my measurement rig and ckecked for any errors. But I cannot tell which measurement, or to what frequency, is correct:
The black colored near field measurement is the same DSP settings as the blue colored far field measurment. The far field is gated to 4,2 ms and this is good to exclude any relevant reflexions. Can somebody help me to solve this disagreement?
- From Arta AN 4 I learned that the directional effect of sound pressure introduces dips in the near field response, as formalized here, but I did not understand how to apply this to the driver (r = 0.131 m):

https://artalabs.hr/AppNotes/AN4-FreeField-Rev03eng.pdf - From Joe D'Appolito's article at audioxpress I learned that a practical upper limit for near field is calculated to exlude the dips as in the following fomula:

Measuring Loudspeaker Low-Frequency Response | audioXpress
Translated into metric terms and applied to the woofer I am using (d=26,2 cm) this formula says 418 Hz is the limit above which dips will occur in the measurement that are not percieved in far field listening (4,311*2,54/26,2). - The point of disagreement though, does not seem to be dips, but a peak and the "before" of the near field correction does look much better in far field than the "after", the after far field being the same as the black near field curve. The near field corrected far field measurement after applying a PEQ cut to the peaking in near field measurement between 500-700 Hz, features a gentle dip now in this area, although there is still a formidable peak left as seen in the near field.
Deffinitely look at far field for 400-1000Hz. It correlates better to what you hear than nearfield. Who knows what's going on there - it could be some diffraction since it is dip-peak combo.
Nearfield is properly done from less than 1cm and it serves to check low frequency extension. Depending on the driver size in relation to wavelenght, you are measuring 2pi conditions up to some frequency. After that response goes all over the place.
Go to Hificompass and observe what happens at nearfield (20mm) compared to farfield for exact same driver in controlled conditions.
I'm very pleased with how your project turns out to be. Looking at measurements of JBL 4349 and i see no advantage in frequency response or directivity. Give us some pics of your new cabinets. I would like to see pprt measurements also. It would be nice to get rid of the port resonance you measured last time. It is just function of port size and position on cabinet. Test rear baffle would help.
Last edited:
When I measured the new cabinet I did not know where the vent would be working at and so I did not correct the center frequency of the Boost PEQ. In the old cabinet, the vent was working at 32 Hz, PEQ at 36, being 25 cm long. In the new cabinet, the vent is working at around 34.5, PEQ still at 36, vent bein 20 cm long flange to flange. So the results might change if the PEQ is relocated to a more effective position. Also, the data for new graph was calculated within REW, the older in Vituix. So I can nly hope that they are comparable.
This is the comparison:
old

new

And this is the looks of new cabinet prototype:


This is the comparison:
old
new
And this is the looks of new cabinet prototype:
Although it looks strange with your waveguide being so far from the woofer, my configuration will be very similar to yours. Since i use B52 waveguide, i won't be able to get them much closer than that. C-C will be around 30-33cm or so.
Yeah on a quick thought it seems there is no reason to use asymmetric waveguide other than get the box a bit smaller. Smaller size is achieved by sacrificing some audio quality (pattern flip). Maybe good for PA to save space and weight or try to reach some more loading for few extra db output but these properties are not important for home HiFi.
Reduced sound to floor and ceiling might be good argument for narrower vertical pattern? With 1m listening height, 3m listening distance and (european) 2,4m ceiling height the angle to ceiling reflection point is roughly ~45 degrees and to floor reflection point roughly 33 degrees. 60 deg nominal vertical pattern in a waveguide would reduce the floor reflection about 6db. Ceiling reflection is reduced more due to greater angle. Any waveguide would have less floor and ceiling reflection than direct radiating tweeter. I don't know if few db reduced floor /ceiling reflection is worth having the pattern flip? There is a thread, gotta read that again 🙂 Combating Pattern Flip
Reduced sound to floor and ceiling might be good argument for narrower vertical pattern? With 1m listening height, 3m listening distance and (european) 2,4m ceiling height the angle to ceiling reflection point is roughly ~45 degrees and to floor reflection point roughly 33 degrees. 60 deg nominal vertical pattern in a waveguide would reduce the floor reflection about 6db. Ceiling reflection is reduced more due to greater angle. Any waveguide would have less floor and ceiling reflection than direct radiating tweeter. I don't know if few db reduced floor /ceiling reflection is worth having the pattern flip? There is a thread, gotta read that again 🙂 Combating Pattern Flip
Last edited:
Well, when it comes to looks, I am not too concerned. I actually like the wider separation aesthetically, but that is not what it's all about. C-C is 33 cm here, as to 26.5 before. I was concerned with the pattern flip for a while now, but if I understand the in-room response correctly, there is only some toning to the upper mids now and this is acceptable for me on an intermediate-term (the next year or so):

I do not really like the whole waveguide and it's issues too much. It strives at HF-dispersion, but the directivity errors below 3000 Hz and the reflections introduced by the adapter tubing are problematic. All PT-waveguides seem to need considerable amount of EQ to tame reflections. Some time, I hope I will get myself an Ath4 PT-waveguide CNCed. Only need to enroll at art school again to use their machine. 🙂 Would be nice to separate those reflections which are introduced by the adapter from those which are inherent to the waveguide curvature and loading slots:


Most obvious sonic difference to my ears is the port shifted to the back. It is only supporting at LF now, MF must be wholly set with woofer alone. I missed some "warmth" first, but I assume it was the leaking mid frequencies that added up on top of woofer response that left this impression. Also, I cannot hear a problem with driver integration, they still play together very nicely. Yes, the vertical lobe is a little smaller, but I doubt this is a problem with this asymmetric waveguide.


0.95 lambda: -6db = 40 degrees, -3db = 30 degrees
1.2 lambda: -6db = 37 degrees, -3 db = 26 degrees


One question I have left before I proceede The port position above Hypex module is a tight fit, because of the space the compression driver requires. If I will at a later point choose a higher waveguide, the compression driver will presumably block the current port position. In centered the port to maximize mid-range exclusion/baffle width. But in a future layout, I might not have this space at hand. do you think it is acceptable to make an asymmetric position, with the Hypex shifted to one side and the port put to the other? This reduces midrange-exclusion and I am not sure if internal reflextions from woofer backwave will be an issue if the inset Hypex-holder is at one side, but then again I saw interios of speaker which where really stuffed with a lot of things, so some do not consider this an issue I suppose.
I do not really like the whole waveguide and it's issues too much. It strives at HF-dispersion, but the directivity errors below 3000 Hz and the reflections introduced by the adapter tubing are problematic. All PT-waveguides seem to need considerable amount of EQ to tame reflections. Some time, I hope I will get myself an Ath4 PT-waveguide CNCed. Only need to enroll at art school again to use their machine. 🙂 Would be nice to separate those reflections which are introduced by the adapter from those which are inherent to the waveguide curvature and loading slots:
Most obvious sonic difference to my ears is the port shifted to the back. It is only supporting at LF now, MF must be wholly set with woofer alone. I missed some "warmth" first, but I assume it was the leaking mid frequencies that added up on top of woofer response that left this impression. Also, I cannot hear a problem with driver integration, they still play together very nicely. Yes, the vertical lobe is a little smaller, but I doubt this is a problem with this asymmetric waveguide.
0.95 lambda: -6db = 40 degrees, -3db = 30 degrees
1.2 lambda: -6db = 37 degrees, -3 db = 26 degrees
One question I have left before I proceede The port position above Hypex module is a tight fit, because of the space the compression driver requires. If I will at a later point choose a higher waveguide, the compression driver will presumably block the current port position. In centered the port to maximize mid-range exclusion/baffle width. But in a future layout, I might not have this space at hand. do you think it is acceptable to make an asymmetric position, with the Hypex shifted to one side and the port put to the other? This reduces midrange-exclusion and I am not sure if internal reflextions from woofer backwave will be an issue if the inset Hypex-holder is at one side, but then again I saw interios of speaker which where really stuffed with a lot of things, so some do not consider this an issue I suppose.
Last edited:
- Home
- Loudspeakers
- Multi-Way
- Digital BSC question