In case you take 1kHz + 190kHz test signal, (1kHz component must be clean), 192kHz sampling, no anti-aliasing filter, do you get the spectrum without 2kHz component?
Hi Edmond,
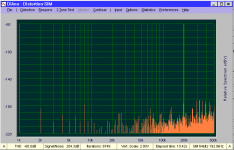
I mean 1kHz/0dB as a fundamental a 190kHz/-60dB as a second component. Thank you.
Hi Pavel,
Please have look. No 2kHz component, just one line at 190kHz.
BTW1: the ordinary spectrum does show a 2kHz component, of course.
BTW2: I've used 999.95Hz, as DiAna doesn't like 1kHz. Hope you don't mind. 😉
Cheers,
E.
Attachments
That's right.Excuse my ignorance, I still do not see the principle. If you have no bandpass filter,
It is what it is. DiAna didn't find a signal at 382kHz, simply because there's nothing at that frequency.how do you know the signal at -60dB is 190kHz and not e.g. in the next mirror, e.g. 190 + 192 = 382kHz?
The first FFT bin is just DC and not shown. The next bin contains the fundamental (i.e. 19kHz). So there is no 2kHz bin at all.Your spectrum chart starts at the first harmonic - 19kHz. If it started at 0, would we see the 2kHz component there?
Cheers,
E.
Hi Pavel,
Please have look. No 2kHz component, just one line at 190kHz.
BTW1: the ordinary spectrum does show a 2kHz component, of course.
BTW2: I've used 999.95Hz, as DiAna doesn't like 1kHz. Hope you don't mind. 😉
Cheers,
E.
Great, thank you!
PS: The spectra as shown above are FFT's (or more precisely FHT's) of the residual. That's why it starts at 19kHz (being the fundamental in this case).[...]
Your spectrum chart starts at the first harmonic - 19kHz. If it started at 0, would we see he 2kHz component there?
Remember: DiAna is an distortion analyzer in the first place and not a spectrum analyzer.

Remember: DiAna is an distortion analyzer in the first place and not a spectrum analyzer.
Maybe I am just stupid, but I am not yet giving up.
I have read your website, which says that DiAna will extract signals "even if they are deeply burried in noise", and measue "far beyond the Nyquist frequency". Sounds like a very interesting and useful tool! But it can only be useful if one knows how it works, because otherwise it is impossible to interpret the results.
So how does it work? What are the underlying methods and procedures?
How does DiAna recover signals that are buried in noise?
How does DiAna reconstruct signal components from "behind the Nyquist wall"?
What do you mean by "distortion analyser, not a spectrum analyser"? (These terms seem to have a very specific meaning to you, but I believe they mean something else to me.)
He probably investigates only base frequency + multiples (harmonics) and doesn't care what is between them. If there is a spuriae, you wouldn't see it.
Perhaps his phrase: "distortion analyser, not a spectrum analyser", means that the first task is to remove the fundamental from the signal, producing the residual waveform. THD+N is now directly obtained. The residual is further analyzed, in some unspecified manner, to extract the harmonics.
He probably investigates only base frequency + multiples (harmonics) and doesn't care what is between them. If there is a spuriae, you wouldn't see it.
But that's not different to a spectrum analyser that ignores what's between the harmonics, for example when it calculates THD (in contrast to THD+N). And it does not explain how DiAna extracts stuff from below the noise floor or behind the "Nyquist wall". If DiAna does all this, it must do something very different than what most other tools do. I'd like to understand what it does, and how.
Perhaps his phrase: "distortion analyser, not a spectrum analyser", means that the first task is to remove the fundamental from the signal, producing the residual waveform. THD+N is now directly obtained. The residual is further analyzed, in some unspecified manner, to extract the harmonics.
Many spectrum analysers actually do exactly what you describe, except that with most of them the procedure of how they do it is made clear to the user.
Last edited:
Noise floor is meaningful only if we define analysis bandwidth or bin width. If noise is defined over 20kHz band, then it is no problem to measure "under noise floor" by narrow band analysis.
DiAna is able to extract signals far into the noise by reducing the noise below the signal level.
Don't ask me. Ask Edmond.
Don't ask me. Ask Edmond.
DiAna works similarly to the Shibasoku distortion analysis mode. On the Shibasoku it first measures the incoming frequency, then locks a local oscillator to a multiple (16 X I think) of that frequency and uses that to sample the output after the notch filter. Because its synchronous to the fundamental the sampling always happens at the same point in the waveform. The samples are stored in bins and averaged with the incoming signal. Since the signal is the same in every cycle and the noise is not the noise is averaged out permitting measurement of the harmonics even well below the noise.
This is only useful for analyzing repetitive signals and will ignore signals that are not synchronous with the fundamental.
I believe what DiAna does is very similar, however it reconstructs from the samples provided instead of syncing a clock to the fundamental to get synchronous samples. Also it takes advantage of much higher resolution samples (the ADC and DAC in the Shibasoku are 12 bit) so it doesn't need the filter at the input.
Combining these techniques with what Phofman has managed to figure out: Digital Distortion Compensation for Measurement Setup could get substantially lower distortion measurements without resorting to heroic efforts like the 100 or so relays in a Shibasoku 725.
I think these questions were answered at the beginning of the thread. Edmond uses a coherent FFT.
Demian I was going to mention this but you beat me to it.
It is also possible to obtain the same results as the Shibasuko method by under sampling and extracting the bins from many cycles of fundamental. As many cycles as there is bins.
It is also possible to obtain the same results as the Shibasuko method by under sampling and extracting the bins from many cycles of fundamental. As many cycles as there is bins.
First read post #115 where I've explained how it works.Maybe I am just stupid, but I am not yet giving up.
I have read your website, which says that DiAna will extract signals "even if they are deeply burried in noise", and measue "far beyond the Nyquist frequency". Sounds like a very interesting and useful tool! But it can only be useful if one knows how it works, because otherwise it is impossible to interpret the results.
Coherent waveform reconstructionSo how does it work? What are the underlying methods and procedures?
Simply by averaging out the noise.How does DiAna recover signals that are buried in noise?
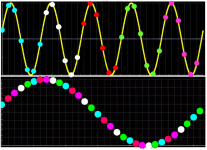
See picture below, showing how "coherent waveform reconstruction" works.How does DiAna reconstruct signal components from "behind the Nyquist wall"?
A (FFT) spectrum analyzer shows a the spectrum that starts with f = fs/size up to fs/2 (where size = FFT size and fs = sampling rate), while the THD spectrum of DiAna starts at the fundamental frequency (ff) up to ff/(2*size) and thus may exceed the Nyquist frequency as well. Pretty different I would say and that's the reason I call it a distortion analyzer.What do you mean by "distortion analyser, not a spectrum analyser"? (These terms seem to have a very specific meaning to you, but I believe they mean something else to me.)
BTW, in case you are unsure, for whatever reason, about the measurement results of DiAna, you always can check or compare the results by means of the builtin simulation feature. But I don't tell you exactly (about the underlying algorithms) how I've done it. DiAna is a pretty unique program and I prefer to keep it that way.
And here's graphical presentation of "coherent waveform reconstruction" and how it "reshuffles" the input signal:
Cheers,
E.
Attachments
Hi Demian,
Firstly, thank you for additional explanation.
Cheers,
E.
Firstly, thank you for additional explanation.
That's right. I'm using the fundamental signal itself to synchronize the averaging (and reshuffling) process. The biggest hurdle, however, was how to calculate the phase of the fundamental, in particular when fundamental and sampling frequency have no common divisor (i.e. when you can't find a number of samples that spans exactly a whole number of fundamental cycles). Eventually, I found the solution (btw, not described in any textbook).DiAna works similarly to the Shibasoku distortion analysis mode. On the Shibasoku it first measures the incoming frequency, then locks a local oscillator to a multiple (16 X I think) of that frequency and uses that to sample the output after the notch filter.
[...]
I believe what DiAna does is very similar, however it reconstructs from the samples provided instead of syncing a clock to the fundamental to get synchronous samples.
[...]
Cheers,
E.
Oh, really?[...] The residual is further analyzed, in some unspecified manner, to extract the harmonics.
The biggest hurdle, however, was how to calculate the phase of the fundamental, in particular when fundamental and sampling frequency have no common divisor (i.e. when you can't find a number of samples that spans exactly a whole number of fundamental cycles). Eventually, I found the solution (btw, not described in any textbook).
That's very true, actually we are hitting the same issue in https://www.diyaudio.com/forums/equ...ensation-measurement-setup-2.html#post5584029 , detection of base frequency phase to generate precise reference sine. Please is any more information on your procedure available? Our preliminary code is available at GitHub - pavhofman/nonlinear-compensation: Compensation of nonlinear sound card distortions for audio measurements , also using octave. I have some ideas about the detection in time domain, consulting/discussing could be a mutual advantage.
Lowering the measurement floor
I'm afraid that won't work, that is, only to a certain extent. The problem is that the distortion of ADC, DAC, op-amps etc, depends on a lot of things (amplitude, frequency, termination impedance, temperature, supply voltage, perhaps even the phase of the moon). Anyhow, DiAna offers two methods to decrease the distortion of the sound card itself by means of a differential measurement. The first one, a poor mans solution, records the distortion of ADC and DAC (in loop back mode) without DUT and saves the result. Then the DUT is inserted into the loop, though one should take care to keep the signal levels of DAC respectively DAC the same as in the previous measurement. Again the distortion is measured and finally subtracted by the saved distortion. Sounds simple, but does it work?
To figure that out I did the second measurement also without DUT. Ideally, the result should be zero distortion. Not so in practice:
First measurement: Lynx L22, F=996.6Hz, V=1Vrms, 1000 records of 16k, BW = 20kHz D = -121.5dB.
Second measurement: dito, done 20 minutes later, D = also -121.5dB.
After subtracting I got a disappointing D= -138.3dB, an improvement of the measuring floor of only 16.8dB. One hour later D was -136.2dB or an improvement of the measuring floor of only 14.9dB. The next day it will probably even worse due to drift. Note however that even without any kind drift, the floor will never be zero because of noise.
The second method is way more complex. It makes use of multiplexer in order to:
1. Interleave the reference and test measurements to eliminates drift effects as pointed out above.
2. Alternately switching the channels for reference and test measurements to compensate for imbalances between the ADC/DAC channels.
3. Measuring the phase and frequency response of DUT, which will be needed to subtract the distortion of the ADC/DAC itself in a meaningful way.
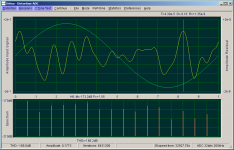
A disadvantage of this method is that one have to build a dedicated interface housing the multiplexer and other stuff like the servo to keep the ADC voltage constant. See 1st pic of an experimental prototype.
Anyhow, the measurement floor with this setup was much better: -166dB. see 2nd pic.
(Note: Only the pro version supports this method)
A third method to lower the measuring floor makes use of the ubiquitous notch and band-pass filters, way simpler than the second method, but for each frequency one needs a dedicated filter set. The next version of DiAna supports frequency and phase compensation of notch filters to reconstruct the shape of the residual.
Cheers,
E.
edit: Again on hour later and at a slightly lower temperature, improvement of the measuring floor (of method 1) dropped to a meagre 6.8dB.
[...]
Combining these techniques with what Phofman has managed to figure out: Digital Distortion Compensation for Measurement Setup could get substantially lower distortion measurements [...]
I'm afraid that won't work, that is, only to a certain extent. The problem is that the distortion of ADC, DAC, op-amps etc, depends on a lot of things (amplitude, frequency, termination impedance, temperature, supply voltage, perhaps even the phase of the moon). Anyhow, DiAna offers two methods to decrease the distortion of the sound card itself by means of a differential measurement. The first one, a poor mans solution, records the distortion of ADC and DAC (in loop back mode) without DUT and saves the result. Then the DUT is inserted into the loop, though one should take care to keep the signal levels of DAC respectively DAC the same as in the previous measurement. Again the distortion is measured and finally subtracted by the saved distortion. Sounds simple, but does it work?
To figure that out I did the second measurement also without DUT. Ideally, the result should be zero distortion. Not so in practice:
First measurement: Lynx L22, F=996.6Hz, V=1Vrms, 1000 records of 16k, BW = 20kHz D = -121.5dB.
Second measurement: dito, done 20 minutes later, D = also -121.5dB.
After subtracting I got a disappointing D= -138.3dB, an improvement of the measuring floor of only 16.8dB. One hour later D was -136.2dB or an improvement of the measuring floor of only 14.9dB. The next day it will probably even worse due to drift. Note however that even without any kind drift, the floor will never be zero because of noise.
The second method is way more complex. It makes use of multiplexer in order to:
1. Interleave the reference and test measurements to eliminates drift effects as pointed out above.
2. Alternately switching the channels for reference and test measurements to compensate for imbalances between the ADC/DAC channels.
3. Measuring the phase and frequency response of DUT, which will be needed to subtract the distortion of the ADC/DAC itself in a meaningful way.
A disadvantage of this method is that one have to build a dedicated interface housing the multiplexer and other stuff like the servo to keep the ADC voltage constant. See 1st pic of an experimental prototype.
Anyhow, the measurement floor with this setup was much better: -166dB. see 2nd pic.
(Note: Only the pro version supports this method)
A third method to lower the measuring floor makes use of the ubiquitous notch and band-pass filters, way simpler than the second method, but for each frequency one needs a dedicated filter set. The next version of DiAna supports frequency and phase compensation of notch filters to reconstruct the shape of the residual.
Cheers,
E.
edit: Again on hour later and at a slightly lower temperature, improvement of the measuring floor (of method 1) dropped to a meagre 6.8dB.
Attachments

Last edited:
Spuriae
I's not me who "doesn't care what is between them", rather it's a logical and inevitable consequence of coherent waveform reconstruction, that is synchronized by the fundamental.
I'm also interested in spuriae. That's why DiAna also computes a regular spectrum.
Cheers,
E
Hi Pavel,He probably investigates only base frequency + multiples (harmonics) and doesn't care what is between them. If there is a spuriae, you wouldn't see it.
I's not me who "doesn't care what is between them", rather it's a logical and inevitable consequence of coherent waveform reconstruction, that is synchronized by the fundamental.
I'm also interested in spuriae. That's why DiAna also computes a regular spectrum.
Cheers,
E
- Home
- Design & Build
- Equipment & Tools
- DiAna, a software Distortion Analyzer