Not to worry! This cct could easily be copied onto a 6AU6 followed by something like 6BQ7/6BK7/6BZ7, Etc.
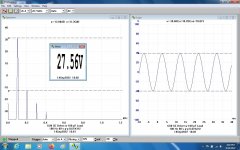
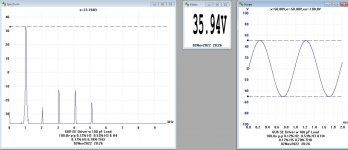
But here for all is the real deal. Refer to the performance of the cct delivering 80v P-P into the 100 pF load.
The H2 is just 0.61%. At this much drive the 2A3 itself will be well beyond that. someone could do a
graphical solution on the 2A3 plate curves & get the 2A3 H2 D%. Or I will do that tomorrow.
The G2 ripple at 100 Hz is 6.1v p-p. How much does that matter? G2 influence is 1/MU of g1g2. From the Mullard data sheet MU of g1g2 is 35.
That then has the same effect as an input signal as 6.1 / 35 v p-p. Not much. But easily fixed using a 0.5 microF cap for bypass. 👍
No gassy regulators or Zeners required. Best to aim for a KISS solution.😀
Attachments


So here are the results for the 2A3 driven 80v p-p using the graphical solution.
At 3W the H2 is 5%, a lot more than the 6U8 thing as a driver. Improving the driver won't help much.
The graphical method is reproduced again for anyone that would like to try it.
It seems that since the introduction of so many digital aids that many have either lost or never
learned how to solve problems by the well known traditional methods. 👎
If some of my stuff sounds like an instructor, I did exactly that for 2yrs. So it was Physics, Calculus,
Electronic Circuits & Measurements. It was circa 1972, so mostly SS, A lot of AC control circuitry.
And frequent beer nights.😀
Today I couldn't solve a Differential Equation if my life depended on it. But I can spell it anyway.
Attachments
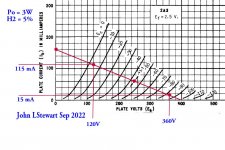

The argument that 5% 2A3 distortion at 3 W makes driver distortion unimportant is only valid if one listens at 3 W. 3 W is a headroom for real listening at 0.3 W (or less).So here are the results for the 2A3 driven 80v p-p using the graphical solution.
At 3W the H2 is 5%, a lot more than the 6U8 thing as a driver. Improving the driver won't help much.
The graphical method is reproduced again for anyone that would like to try it.
It seems that since the introduction of so many digital aids that many have either lost or never
learned how to solve problems by the well known traditional methods. 👎
If some of my stuff sounds like an instructor, I did exactly that for 2yrs. So it was Physics, Calculus,
Electronic Circuits & Measurements. It was circa 1972, so mostly SS, A lot of AC control circuitry.
And frequent beer nights.😀
Today I couldn't solve a Differential Equation if my life depended on it. But I can spell it anyway.
For a well behaved triode gain stage circuit (driver stage or output stage), The 2nd harmonic distortion follows a rule.
In the case of 3W versus 0.3W (300mW) . . .
(and the driver at 80V peak to peak versus at 25.3V peak to peak, respectively):
2nd Harmonic Distortion:
Output stage: 3W @ 5%, will be 1.58% @ 0.3W.
Driver Stage: 80V peak to peak, @ 0.61%, will be 0.193% @ 25.3V peak to peak.
The point is, in those well behaved regions, the Ratio of driver distortion versus output stage distortion, is constant.
5% / 1.58% = 3.16
0.61% / 0.193 = 3.16
You ask where the number 3.16 came from?
The power ratio is 10 (3W / 0.3W)
Power = V(squared)/R, and load R is constant
So when power changes by 10, voltage changes by Root (10).
Root (10) to 3 places is 3.16.
I hope this is useful to the thread's present discussion.
Given how the driver is overwhelming H2 I'ld expect some cancellation with the output stage. 5% should be worst case.Improving the driver won't help much.
All this chatter is temping me to sideline a pentode SE project entering panel cutting stage to light up the Gold Lion 2A3s in storage for 15+ years.
5% 2nd harmonic distortion is -26dBc.
26dB less than the fundamental.
If you look at the Western Electric chart for the 300B, at plate to filament voltages of about 200V to 450V, and plate loads from about 1k to 5k, and plate currents from about 30mA to 90mA . . .
You will often see the 2nd harmonic distortion is -26dBc. (5%).
But then take the 300B plate curves, and pick a given quiescent plate voltage and plate current, and draw a load line.
Now, if the load is varied by -50% and +100% from the rated load impedance, the slope of the load line will change drastically.
That causes the 2nd Harmonic distortion to change a lot too.
Example: A 300B with a 3k Ohm primary and 8 Ohm secondary transformer drives a loudspeaker.
That 8 Ohm rated loudspeaker may vary from 4 Ohms to 16 Ohms at various frequencies.
That means the plate load varies -50% to + 100% from the 3k Ohm value (1.5k Ohms to 6k Ohms).
So the 2nd Harmonic distortion varies too . . .
But the driver load is constant, no load changes on the driver.
2nd Harmonic cancellation of driver and output stage varies too . . .
Just Saying
Last edited:
Would final anode feedback be helpful with 2H cancellation or just make it level dependent instead of frequency dependent?
Forget final anode NFB, NFB should be from the OPT Secondary. That way some of the non-linearity of the OPT is reduced.Would final anode feedback be helpful with 2H cancellation or just make it level dependent instead of frequency dependent?
As well as the OPT sec wdg resistance & the primary. 2A3 doesn't did much NFB, 6db should be enough. So no danger of instability.
And very effective to improve Damping Factor (DF).
The fourth harmonics variation more dominant.So the 2nd Harmonic distortion varies too . . .
300B simulation driving to A1.
load THD 2nd 3th 4th
5k 3.04% -30dB -46dB -78dB
4k 3.77% -29dB -43dB -64dB
3k 5.14% -26dB -39dB -54dB
2k5 6.33% -24dB -36dB -50dB
2k 8.20% -22dB -33dB -46dB
One question:The fourth harmonics variation more dominant.
300B simulation driving to A1.
load THD 2nd 3th 4th
5k 3.04% -30dB -46dB -78dB
4k 3.77% -29dB -43dB -64dB
3k 5.14% -26dB -39dB -54dB
2k5 6.33% -24dB -36dB -50dB
2k 8.20% -22dB -33dB -46dB
how the simulation can calculate the thd where there aren't any specification of the real details of the OT as inductance (low frequency) parasitic (hig frequency)?
And your numbers at which frequency and level are taken (simulated) ?
Wich is the Va and Ibias?
Walter
415V, 80mA, -81V (spice model dependent values).One question:
how the simulation can calculate the thd where there aren't any specification of the real details of the OT as inductance (low frequency) parasitic (hig frequency)?
And your numbers at which frequency and level are taken (simulated) ?
Wich is the Va and Ibias?
Walter
The driving on the 300B grid is 81V peek, at 1kHz.
The transformer is "ideal" 1:1, the load transformed from secondary to primary.
Lload= Rload/(2*pi*20Hz)
This is a simplification, but shows the harmonics behaviour at different load.
You can try it in "real word".
1:1 15W, 80mA capable transformer at least 50H inductance, various load on secondary, FFT analyser.
1:1 15W, 80mA capable transformer at least 50H inductance, various load on secondary, FFT analyser.
Great question!
I will try and find the Western Electric 300B chart.
I hope to attach it to this post, if not I will post it later.
I am quite sure that the WE engineers chart only includes the 300B distortion, not the output transformer distortion.
I think that is quite wise of them.
I believe the chart assumes a purely resistive load.
Instead, just Imagine a capacitor that is in parallel with a Load.
The capacitor will attenuate more and more as the frequency increases. upper frequencies, including the harmonics.
Pure resistive load Triode gain is essentially: u x (Load impedance / (Load Impedance + Plate resistance)).
The only question about the actual gain with a load that is a capacitor and resistor in parallel is:
What is the capacitive reactance Ohms, load resistance Ohms, and what fundamental and harmonic frequencies are we talking about.
With that kind of load, the load on the plate is the complex impedance of the capacitor and resistor in parallel. That number gets smaller as the frequency increases, so gain gets smaller too.
Any harmonic distortion frequency is dependent on two things:
The non linearity of the transfer curve, and the gain at the harmonic frequency.
I hope that answers the question about whether the chart with, or without, an output transformer.
(and a few more things to think about too).
I will use always a test circuit.You can try it in "real word".
1:1 15W, 80mA capable transformer at least 50H inductance, various load on secondary, FFT analyser.
And the test of the OT only ( used in the circuit)
Then the input circuit that drives the power tube
This is the way, for me, to get the results that help you to fix the final version.
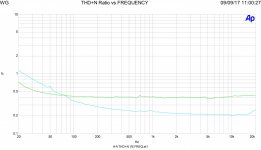
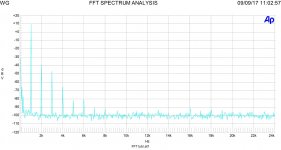
In attach a FFT of a s.e. of 300B with a OT custom with a ratio of 20:1, the single secondary set to 5 ohms ( my choice)
Then the frequency response at 8 watt
Then the THD vs frequency at 1 watt, an important tes ( mybe the most important, for me)
Last a test on three different OT inserted on same circuit and different bias current.
These are one little parts of the test normally I do when a real circuit is on the desk
(I have posted these diagram in other thread)
Attachments


waltube,
Thanks for the information on your method, and performance charts.
I see you used a 20:1 transformer. That primary is 2000, 2400, and 3200 Ohms for 5, 6, and 8 Ohms load respectively. Interesting.
I am attaching an example of the tests I usually do on any amplifier that I design and build, or that I modify.
It gives me an estimate of the amplifier performance.
For the fast rise square wave response, I note the presence or absence and amplitude of ringing, and the rise time and fall times.
For the CD Impulse, I note the flatness across the low frequency to 25kHz range, using an FFT (I never saw a resonance in that test).
One example amplifier:
Push Pull 7591S 12AY7 cathode coupled with LM334 CCS Edcor 10k PP Triode Wired 8 Ohm Load on 4 Ohm Tap
Date: _____ _____ __ 20 Henry Choke input B+ Or ____ uF Capacitor input B+
Triode Wired, 100 Ohm Screen R 7591S Cathode 1 Bias ______ V Cathode 2 Bias ______ V B+ ______ V
12AY7 Plate 1 _____ V Plate 2 _____ V Common Cathodes Bias _____ V
1 Watt, 1kHz, 2nd Harmonic - ______ dBc _____ %. 3rd Harmonic - ______ dBc _____ %
< Clip @ ______ Vrms ______ Watt
1V no load ______ V 8 Ohm load ______ Damping Factor
215mV in ______ V out ______ Gain ______ dB
1kHz 2.828 V 19.999 kHz ______ V 21.5 Hz ______ V 40 Hz ______ V
- ______ dB - ______ dB - ______ dB
Impulse:
10kHz Square Wave:
Hum _____ uV
Last edited:
Another look at the 6U8 Driver, this time with the screen volts raised by paralleling a 1.5M resistor wthe Rg2.
So the screen resistor is now 390Kll1500 K, ~310K. Gain stay about the same, the distortion products look very different.
Next test will be D% at various levels.
So the screen resistor is now 390Kll1500 K, ~310K. Gain stay about the same, the distortion products look very different.
Next test will be D% at various levels.
Attachments

Why wouldn't someone ALWAYS pick the 30 dB second, 45 third from the chart above? Seems to be the sweet spot.
Work has has gotten in the way of audio design since August, so I'm just returning now to find a ton of helpful technical/design information that -- as novice designer -- I've been wondering about. So, thank you so much to JH Stewart and everyone who chimed in. I'll be going back through it all with a fine-toothed comb to take notes.
Returning to this project, I'm thinking about slew rate and input stage design for the first time.
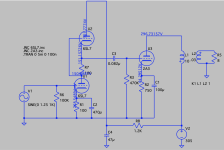
I've re-breadboarded the JE Labs SRPP 6SL7 --> 2A3 circuit, which is definitely the best sounding one so far. It uses 2.2K cathode resistors to run the two halves of the 6SL7 at about 145V/0.7mA each (attached image). This is a well-respected circuit that is sometimes sold commercially. However, 0.7mA seems low, unless the two halves would sum to 1.4mA?
Gordon Rankin provides a slew rate/input current calculation method in sidebar B of his Sound Practices article on the Bugle 45 amp, which uses the 6072A (12AY7) in SRPP (attached PDF). He determined that the grid of the 45 tube would need a minimum of 1.1mA from the input stage to avoid slewing problems at full output. He decided to bias the 6072 at 2mA to leave plenty of headroom.
I followed his steps for the 45 tube to make sure I was doing the math right, and then I applied it to the JE Labs 2A3 circuit. For the SRPP 6SL7 --> 2A3, the minimum input stage current, according to Rankin's method, would need to be about 2.12mA.
1. 2pi x 20KHz x 45V = 5,654,862 or 5.7V/uS
2. 5 x 5.7V/uS = 28.5V/uS
3. Ct = 16.5pF x (3.3 + 1) + 7.5pF = 74.325pF
4. I = 74.325pF x 28.5V/uS = 2.118mA
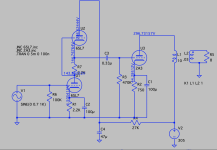
So, I figured I would try designing the input circuit, like Gordon, to run at a current that is comfortably above the minimum. I thought I'd shoot for 3mA, and then went back to LTSpice to model the behavior. Changing the 2.2K cathode resistors to 100R, of which I have plenty lying around, and lowering the power supply filter resistor to 1.2K, should net an operating point of about 150V/2.7mA per section (0.4 watt plate dissipation @40% of the maximum), which is more than 0.5mA above the calculated minimum of 2.12mA (see attached image).
I'll breadboard it to hear if there's an audible difference, but I'm wondering what we think about this design process for a circuit using an SRPP input stage. Does it make sense to design the input stage so that each 6SL7 half is comfortably above this calculated minimum of 2.12mA? If so, is 2.7mA enough?
Returning to this project, I'm thinking about slew rate and input stage design for the first time.
I've re-breadboarded the JE Labs SRPP 6SL7 --> 2A3 circuit, which is definitely the best sounding one so far. It uses 2.2K cathode resistors to run the two halves of the 6SL7 at about 145V/0.7mA each (attached image). This is a well-respected circuit that is sometimes sold commercially. However, 0.7mA seems low, unless the two halves would sum to 1.4mA?
Gordon Rankin provides a slew rate/input current calculation method in sidebar B of his Sound Practices article on the Bugle 45 amp, which uses the 6072A (12AY7) in SRPP (attached PDF). He determined that the grid of the 45 tube would need a minimum of 1.1mA from the input stage to avoid slewing problems at full output. He decided to bias the 6072 at 2mA to leave plenty of headroom.
I followed his steps for the 45 tube to make sure I was doing the math right, and then I applied it to the JE Labs 2A3 circuit. For the SRPP 6SL7 --> 2A3, the minimum input stage current, according to Rankin's method, would need to be about 2.12mA.
1. 2pi x 20KHz x 45V = 5,654,862 or 5.7V/uS
2. 5 x 5.7V/uS = 28.5V/uS
3. Ct = 16.5pF x (3.3 + 1) + 7.5pF = 74.325pF
4. I = 74.325pF x 28.5V/uS = 2.118mA
So, I figured I would try designing the input circuit, like Gordon, to run at a current that is comfortably above the minimum. I thought I'd shoot for 3mA, and then went back to LTSpice to model the behavior. Changing the 2.2K cathode resistors to 100R, of which I have plenty lying around, and lowering the power supply filter resistor to 1.2K, should net an operating point of about 150V/2.7mA per section (0.4 watt plate dissipation @40% of the maximum), which is more than 0.5mA above the calculated minimum of 2.12mA (see attached image).
I'll breadboard it to hear if there's an audible difference, but I'm wondering what we think about this design process for a circuit using an SRPP input stage. Does it make sense to design the input stage so that each 6SL7 half is comfortably above this calculated minimum of 2.12mA? If so, is 2.7mA enough?
Attachments
Last edited:
- Home
- Amplifiers
- Tubes / Valves
- Developing a 2A3 SET