The most awesome damping factor amp causes the most back-emf distortion. (intended to elicit discussion)
Have you already measured this affect and show us the distortion increase and decrease with different DF.... show distortion using amp of low Zo vs 66 Ohm at same spl. ?
THx-RNMarsh
Not yet. The custom current source amp may be here next week. Realistically I will be able to post concrete results in April. I also have have a shielded ACH-01 accelerometer and its associated preamp on the way here. I plan to have acceleration (excursion) , voice coil current and acoustic output all on the same scope screen.Have you already measured this affect and show us the distortion increase and decrease with different DF.... show distortion using amp of low Zo vs 66 Ohm at same spl. ?
THx-RNMarsh
I have specified amplifier Z out of at least 1,000 ohms. I want the current in the voice coil to be as perfect as can practically be. I don't want to merely reduce the back emf distortion (current). I want to completely eliminate it. Less variables to chase after and to characterize. I also think that moving the back emf distortion to the voltage waveform will make it easier to subtract the driving signal and show the distortion as a stand-alone waveform.
I am also looking forward to the test results to be obtained by our Woofertester friend.
Thanks to him for sharing his results so far and for those results he will share in the future.
Thanks to him for sharing his results so far and for those results he will share in the future.
Not yet. The custom current source amp may be here next week. Realistically I will be able to post concrete results in April. I also have have a shielded ACH-01 accelerometer and its associated preamp on the way here. I plan to have acceleration (excursion) , voice coil current and acoustic output all on the same scope screen.
I have specified amplifier Z out of at least 1,000 ohms. I want the current in the voice coil to be as perfect as can practically be. I don't want to merely reduce the back emf distortion (current). I want to completely eliminate it. Less variables to chase after and to characterize. I also think that moving the back emf distortion to the voltage waveform will make it easier to subtract the driving signal and show the distortion as a stand-alone waveform.
I'll be out of the country the first week of April. Then gone the month of May+ So, in the 2nd-3rd weeks of April works for me. 🙂 Nice. This is fun and good stuff, too. Looking forward to the test data!
THx-RNMarsh
I'll be out of the country the first week of April. Then gone the month of May+ So, in the 2nd-3rd weeks of April works for me. 🙂 Nice. This is fun and good stuff, too. Looking forward to the test data!
THx-RNMarsh
As soon as I can take the measurements, I will post them here.
Safe travels, Mr. Marsh.
I have posted a message [Availability of "current-drive" amplifiers as commercial products] to the "Solid State" thread. This was intended to reach wider audience.
That message, I think, is relevant to this sub-thread as well. I just wanted to bring it to your attention.
That message, I think, is relevant to this sub-thread as well. I just wanted to bring it to your attention.
Accelerometer
The accelerometer and associated preamp showed up today. At moderate excursions, the acceleration, and hence excursion, is nicely sinusoidal.
The preamp seems to poop out at 6V p-p with a 9-volt battery. Just under preamp clipping we have: (Driven by voltage amp)
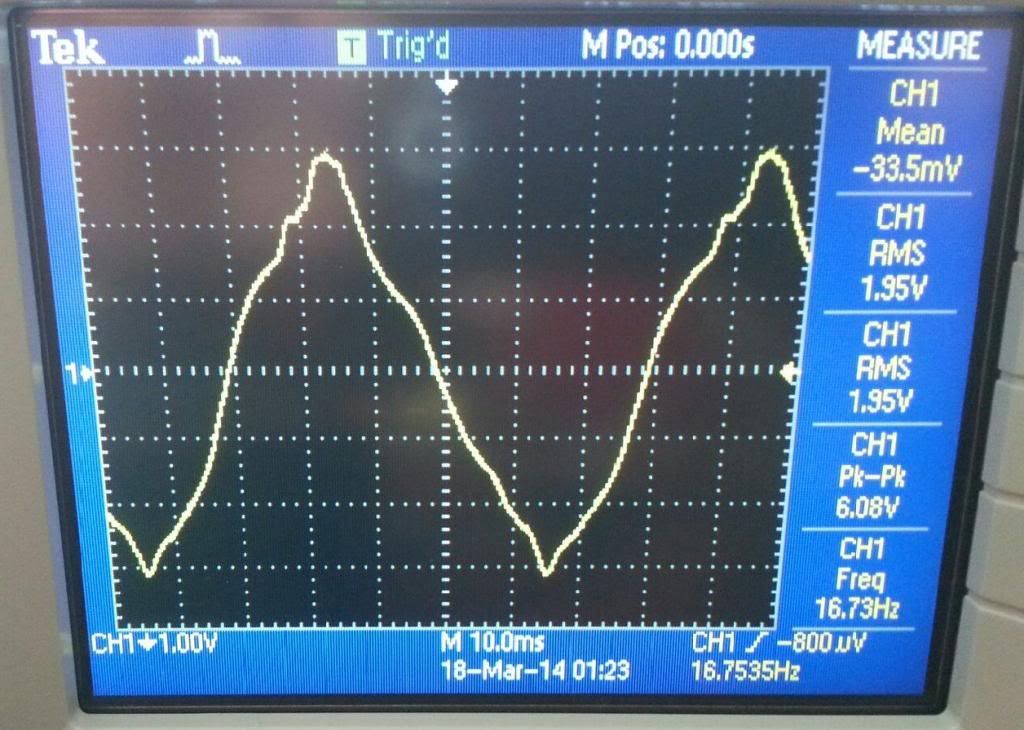
16.75 Hz which is resonance at this power/excursion
acceleration 41.67 g pk, 83.34 g pk-pk
excursion 73.7 mm pk-pk, 2.9 inches pk-pk
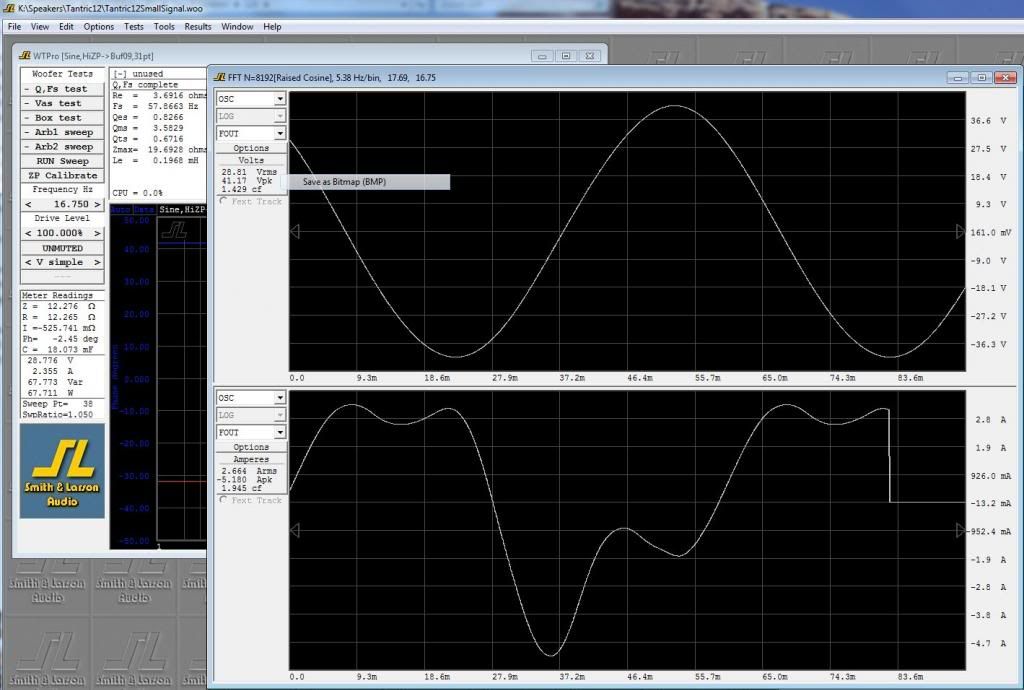
An X-Y of this waveform plotted against current should yield a BL curve with a scaling fudge factor.
This waveform divided by j*w yields velocity which is proportional to acoustic output.
So, you are looking at the waveform of the acoustic output scaled and phase shifted.
Waiting for the current amp to show up.
The accelerometer and associated preamp showed up today. At moderate excursions, the acceleration, and hence excursion, is nicely sinusoidal.
The preamp seems to poop out at 6V p-p with a 9-volt battery. Just under preamp clipping we have: (Driven by voltage amp)
16.75 Hz which is resonance at this power/excursion
acceleration 41.67 g pk, 83.34 g pk-pk
excursion 73.7 mm pk-pk, 2.9 inches pk-pk
An X-Y of this waveform plotted against current should yield a BL curve with a scaling fudge factor.
This waveform divided by j*w yields velocity which is proportional to acoustic output.
So, you are looking at the waveform of the acoustic output scaled and phase shifted.
Waiting for the current amp to show up.
Thanks to our woofertester friend for providing those waveforms. If I may, I will try to make some observations and/or remarks.
(If I remember correctly, the woofer under test is in free air, i.e. not in an acoustic enclosure.)
Waveform 1: The waveform in message #227.
I understand this waveform to be the accelerometer (ACH-01) output signal received from the pre-amplifier (IB-ACH-01 Amplifier Box).
Let's first make an assumption:
Assumption: The accelerometer output signal is an exact and faithful representation of the voice coil's acceleration, i.e.
The waveform in message #227 has been recorded at the (resonance) frequency of 16.73Hz with a large excursion (73.7 mm peak-to-peak).
Observation 1: The positive (+ve) and negative (-ve) half-cycles of the waveform is not (odd-) symmetric. (The +ve half-cycle of the waveform looks different from its -ve half-cycle.)
I don't know what exactly causes this dis-symmetry, but it may be attributable to the non-ideal, asymmetric construction/geometry of the driver.
Observation 2: The +ve and -ve peaks of the waveform (at ~ 90 and 270 degrees) are very sharp and pointy/wedge-like. (The waveform looks like a triangular wave.) In particular, the -ve peaks are very sharp.
Subject to the above assumption, the sharp points/peaks in this waveform mean sudden changes in the coil's acceleration, which in turn means a large magnitude for "jerk" (= first time-derivative of acceleration).
I don't know what exactly causes these sudden 'jerks' or how they can be attributed to the non-linearities in the total mechanical compliance of the coil-cone assembly. I will be glad to learn from anybody who knows.
As woofertester said ("At moderate excursions, the acceleration, and hence excursion, is nicely sinusoidal"), those sharp peaks were not in existence at lesser magnitudes of peak-to-peak excursion.
Does the change in the shape of this waveform (from sinusoidal to triangular) occur gradually or come more like a sudden on-set (as the drive voltage is gradually increased)?
Waveform 2: The waveforms in message #228, in particular, the lower trace showing the coil current.
I assume that the sudden drop (to zero level) in the current waveform at the right end of the scope shot is due to a measurement/experimental error.
Observation 3: [Similar to Observation 1 above] The +ve and -ve half-cycles of the current waveform is not (odd-) symmetric. The +ve half-cycle of the waveform looks different from its -ve half-cycle, even more substantially than the case in Observation 1 for the accelerometer output signal.
Observation 4: (In contrast to the triangular shape of the 'acceleration' signal), the current waveform is like the double-hump camel's back. The difference between the peak levels of the two humps is little during the +ve half-cycle but is very large during the -ve half-cycle.
How can this asymmetry be explained? (e.g. by the co-existence, co-incidence and simultaneous action of the nonlinearities in the 1- Bl-force-factor versus Displacement, 2- Coil-inductance versus Displacement, and 3- Coil-inductance versus Coil-current functions/characteristics of the driver?)
[Unfortunately, we do not have a scope shot that shows the 'acceleration' signal and the 'current' signal on the same screen (i.e. on the same time base). This would permit a meaningful comparison between the two signals and derive some intuition towards the actual relationship between the two quantities.]
As woofertester said for the 'acceleration' signal in message #227,
If my understanding of "Bl Force-factor" is correct and the assumption I made above is true, my interpretation of the 'acceleration' signal is somewhat different from woofertester's.
An X-Y plot of the 'acceleration' signal (the waveform in message #227) versus the coil-current signal (similar to that of the bottom trace in message #228, but obtained simultaneously with the 'acceleration' signal) will not yield a BL curve (as a function of what quantity?) but will simply yield an "acceleration versus current" plot (under the existing operating conditions).
This is because, I think, the instantaneous 'acceleration' is given by:
The plot of this quantity versus coil-current would not yield a direct representation of the BL-Force-Factor but would still be very valuable information regarding the motor mechanism (i.e. electrical-to-mechanical energy conversion) inside the driver.
(I would say the same thing but in a different way.) The time-integral of the 'acceleration' signal should give the voice-coil velocity. However, such an integration in practice would be subject to various inaccuracies including those from the "AC-Response" type accelerometer used (ACH-01). Besides, I am not sure what is meant by "acoustic output" above. The coil velocity would give an indication of "sound intensity" rather than "sound pressure". These two quantities are related to each other, but hearing is sensitive to 'sound pressure'. An indication of 'sound pressure' should be given by the 'acceleration' signal of message #227.
Thanks for reading.
(If I remember correctly, the woofer under test is in free air, i.e. not in an acoustic enclosure.)
Waveform 1: The waveform in message #227.
I understand this waveform to be the accelerometer (ACH-01) output signal received from the pre-amplifier (IB-ACH-01 Amplifier Box).
Let's first make an assumption:
Assumption: The accelerometer output signal is an exact and faithful representation of the voice coil's acceleration, i.e.
Actual Coil-acceleration = K * (Accelerometer output), where K is a pure CONSTANT scaling-factor.
The waveform in message #227 has been recorded at the (resonance) frequency of 16.73Hz with a large excursion (73.7 mm peak-to-peak).
Observation 1: The positive (+ve) and negative (-ve) half-cycles of the waveform is not (odd-) symmetric. (The +ve half-cycle of the waveform looks different from its -ve half-cycle.)
I don't know what exactly causes this dis-symmetry, but it may be attributable to the non-ideal, asymmetric construction/geometry of the driver.
Observation 2: The +ve and -ve peaks of the waveform (at ~ 90 and 270 degrees) are very sharp and pointy/wedge-like. (The waveform looks like a triangular wave.) In particular, the -ve peaks are very sharp.
Subject to the above assumption, the sharp points/peaks in this waveform mean sudden changes in the coil's acceleration, which in turn means a large magnitude for "jerk" (= first time-derivative of acceleration).
I don't know what exactly causes these sudden 'jerks' or how they can be attributed to the non-linearities in the total mechanical compliance of the coil-cone assembly. I will be glad to learn from anybody who knows.
As woofertester said ("At moderate excursions, the acceleration, and hence excursion, is nicely sinusoidal"), those sharp peaks were not in existence at lesser magnitudes of peak-to-peak excursion.
Does the change in the shape of this waveform (from sinusoidal to triangular) occur gradually or come more like a sudden on-set (as the drive voltage is gradually increased)?
Waveform 2: The waveforms in message #228, in particular, the lower trace showing the coil current.
I assume that the sudden drop (to zero level) in the current waveform at the right end of the scope shot is due to a measurement/experimental error.
Observation 3: [Similar to Observation 1 above] The +ve and -ve half-cycles of the current waveform is not (odd-) symmetric. The +ve half-cycle of the waveform looks different from its -ve half-cycle, even more substantially than the case in Observation 1 for the accelerometer output signal.
Observation 4: (In contrast to the triangular shape of the 'acceleration' signal), the current waveform is like the double-hump camel's back. The difference between the peak levels of the two humps is little during the +ve half-cycle but is very large during the -ve half-cycle.
How can this asymmetry be explained? (e.g. by the co-existence, co-incidence and simultaneous action of the nonlinearities in the 1- Bl-force-factor versus Displacement, 2- Coil-inductance versus Displacement, and 3- Coil-inductance versus Coil-current functions/characteristics of the driver?)
[Unfortunately, we do not have a scope shot that shows the 'acceleration' signal and the 'current' signal on the same screen (i.e. on the same time base). This would permit a meaningful comparison between the two signals and derive some intuition towards the actual relationship between the two quantities.]
As woofertester said for the 'acceleration' signal in message #227,
An X-Y of this waveform plotted against current should yield a BL curve with a scaling fudge factor.
If my understanding of "Bl Force-factor" is correct and the assumption I made above is true, my interpretation of the 'acceleration' signal is somewhat different from woofertester's.
An X-Y plot of the 'acceleration' signal (the waveform in message #227) versus the coil-current signal (similar to that of the bottom trace in message #228, but obtained simultaneously with the 'acceleration' signal) will not yield a BL curve (as a function of what quantity?) but will simply yield an "acceleration versus current" plot (under the existing operating conditions).
This is because, I think, the instantaneous 'acceleration' is given by:
Acceleration = [ (Electromagnetically generated force, i.e. Bl*i) minus (Total mechanical forces arising from the coil/cone assembly) ] divided by the total mass of the moving parts.
The plot of this quantity versus coil-current would not yield a direct representation of the BL-Force-Factor but would still be very valuable information regarding the motor mechanism (i.e. electrical-to-mechanical energy conversion) inside the driver.
This waveform divided by j*w yields velocity which is proportional to acoustic output.
So, you are looking at the waveform of the acoustic output scaled and phase shifted.
(I would say the same thing but in a different way.) The time-integral of the 'acceleration' signal should give the voice-coil velocity. However, such an integration in practice would be subject to various inaccuracies including those from the "AC-Response" type accelerometer used (ACH-01). Besides, I am not sure what is meant by "acoustic output" above. The coil velocity would give an indication of "sound intensity" rather than "sound pressure". These two quantities are related to each other, but hearing is sensitive to 'sound pressure'. An indication of 'sound pressure' should be given by the 'acceleration' signal of message #227.
Thanks for reading.
Thanks to our woofertester friend for providing those waveforms. If I may, I will try to make some observations and/or remarks.
(If I remember correctly, the woofer under test is in free air, i.e. not in an acoustic enclosure.)
Waveform 1: The waveform in message #227.
I understand this waveform to be the accelerometer (ACH-01) output signal received from the pre-amplifier (IB-ACH-01 Amplifier Box).
Let's first make an assumption:
Assumption: The accelerometer output signal is an exact and faithful representation of the voice coil's acceleration, i.e.
Actual Coil-acceleration = K * (Accelerometer output), where K is a pure CONSTANT scaling-factor.The waveform in message #227 has been recorded at the (resonance) frequency of 16.73Hz with a large excursion (73.7 mm peak-to-peak).
Observation 1: The positive (+ve) and negative (-ve) half-cycles of the waveform is not (odd-) symmetric. (The +ve half-cycle of the waveform looks different from its -ve half-cycle.)
I don't know what exactly causes this dis-symmetry, but it may be attributable to the non-ideal, asymmetric construction/geometry of the driver.
The Magnetic flux is weaker at the back plate. JBL wrote a white paper about this phenomenon.
Observation 2: The +ve and -ve peaks of the waveform (at ~ 90 and 270 degrees) are very sharp and pointy/wedge-like. (The waveform looks like a triangular wave.) In particular, the -ve peaks are very sharp.
Subject to the above assumption, the sharp points/peaks in this waveform mean sudden changes in the coil'Thacceleration, which in turn means a large magnitude for "jerk" (= first time-derivative of acceleration).
I don't know what exactly causes these sudden 'jerks' or how they can be attributed to the non-linearities in the total mechanical compliance of the coil-cone assembly. I will be glad to learn from anybody who knows.
I think two things are at work. The spider is almost completely stretched out. The B-field is at its weakest point. The speaker barely moves with increased current at the end of Xmax.
As woofertester said ("At moderate excursions, the acceleration, and hence excursion, is nicely sinusoidal"), those sharp peaks were not in existence at lesser magnitudes of peak-to-peak excursion.
Does the change in the shape of this waveform (from sinusoidal to triangular) occur gradually or come more like a sudden on-set (as the drive voltage is gradually increased)?
Gradual.
Waveform 2: The waveforms in message #228, in particular, the lower trace showing the coil current.
I assume that the sudden drop (to zero level) in the current waveform at the right end of the scope shot is due to a measurement/experimental error.
Just a display thing.
Observation 3: [Similar to Observation 1 above] The +ve and -ve half-cycles of the current waveform is not (odd-) symmetric. The +ve half-cycle of the waveform looks different from its -ve half-cycle, even more substantially than the case in Observation 1 for the accelerometer output signal.
Explained above.
Observation 4: (In contrast to the triangular shape of the 'acceleration' signal), the current waveform is like the double-hump camel's back. The difference between the peak levels of the two humps is little during the +ve half-cycle but is very large during the -ve half-cycle.
How can this asymmetry be explained? (e.g. by the co-existence, co-incidence and simultaneous action of the nonlinearities in the 1- Bl-force-factor versus Displacement, 2- Coil-inductance versus Displacement, and 3- Coil-inductance versus Coil-current functions/characteristics of the driver?)
Explained above. B field is weaker at the back plate.
[Unfortunately, we do not have a scope shot that shows the 'acceleration' signal and the 'current' signal on the same screen (i.e. on the same time base). This would permit a meaningful comparison between the two signals and derive some intuition towards the actual relationship between the two quantities.]
The current is highly distorted due to nonlinear BL and inductance moodulation.
As woofertester said for the 'acceleration' signal in message #227,
If my understanding of "Bl Force-factor" is correct and the assumption I made above is true, my interpretation of the 'acceleration' signal is somewhat different from woofertester's.
An X-Y plot of the 'acceleration' signal (the waveform in message #227) versus the coil-current signal (similar to that of the bottom trace in message #228, but obtained simultaneously with the 'acceleration' signal) will not yield a BL curve (as a function of what quantity?) but will simply yield an "acceleration versus current" plot (under the existing operating conditions).
Force = mass * acceleration. BL = mA/I. dimensions for BL are Tesla-meters = Newtons/Ampere
Acceleration vs current curve is proportional to BL
This is because, I think, the instantaneous 'acceleration' is given by:
Acceleration = [ (Electromagnetically generated force, i.e. Bl*i) minus (Total mechanical forces arising from the coil/cone assembly) ] divided by the total mass of the moving parts.The plot of this quantity versus coil-current would not yield a direct representation of the BL-Force-Factor but would still be very valuable information regarding the motor mechanism (i.e. electrical-to-mechanical energy conversion) inside the driver.
(I would say the same thing but in a different way.) The time-integral of the 'acceleration' signal should give the voice-coil velocity. However, such an integration in practice would be subject to various inaccuracies including those from the "AC-Response" type accelerometer used (ACH-01). Besides, I am not sure what is meant by "acoustic output" above.
Volume velocity. velocity of the cone * cone area
The coil velocity would give an indication of "sound intensity" rather than "sound pressure". These two quantities are related to each other, but hearing is sensitive to 'sound pressure'. An indication of 'sound pressure' should be given by the 'acceleration' signal of message #227.
Thanks for reading.
The plot of this quantity versus coil-current would not yield a direct representation of the BL-Force-Factor but would still be very valuable information regarding the motor mechanism (i.e. electrical-to-mechanical energy conversion) inside the driver.
(I would say the same thing but in a different way.) The time-integral of the 'acceleration' signal should give the voice-coil velocity. However, such an integration in practice would be subject to various inaccuracies including those from the "AC-Response" type accelerometer used (ACH-01). Besides, I am not sure what is meant by "acoustic output" above. The coil velocity would give an indication of "sound intensity" rather than "sound pressure". These two quantities are related to each other, but hearing is sensitive to 'sound pressure'. An indication of 'sound pressure' should be given by the 'acceleration' signal of message #227.
Thanks for reading.
Clarification (maybe):
Volume velocity (U) = cone velocity * cone area
Acoustic power is proportional to U^2
SPL in Pascals is proportional to sqrt (U * fudge)
dB SPL is proportional to log base 10 of SPL in Pascals
What is measured with a microphone and what we hear is a function of cone velocity.
So, from a freq response standpoint you want to know cone velocity.
At a particular frequency, with a sinusoidal input, displacement, velocity and acceleration are identical waveforms with phase and magnitude adjustments. That was my point. Looking at the accelerometer waveform tells you something about the acoustic output as well as many other things.
Actually, the cone velocity which is directly proportional to spl, SI at 1m bla bla (ie what we hear) is the Integral of the acceleration waveform. You can't just divide by j*w unless the waveform is a single pure sinewave.The accelerometer and associated preamp showed up today. At moderate excursions, the acceleration, and hence excursion, is nicely sinusoidal.
This waveform divided by j*w yields velocity which is proportional to acoustic output.
So, you are looking at the waveform of the acoustic output scaled and phase shifted.
Velocity & Acceleration waveforms are not identical except for a single pure sinewave.
The nipple points on the peaks are real.The +ve and -ve peaks of the waveform (at ~ 90 and 270 degrees) are very sharp and pointy/wedge-like. (The waveform looks like a triangular wave.) In particular, the -ve peaks are very sharp.
What's happening is as the coil reaches the limits of Xmax (as measured by the coil length and the top plate), the amount of steel inside the coil drops and the instantaneous Inductance drops drastically. This leads to more instantaneous current. It is an unstable phenomena and the coil tries to jump out of the gap and/or hit the backplate.
The simple 'cure' is to let the spider & suspension start limiting. This is counter-intuitive as making the suspension limit actually reduces acoustic THD at these levels.
Don Barlow did a lot of work on this in the 70's. I don't think he published in AES but there was at least one Wharfedale Engineering Memo. I was privileged to work with Don, a true polymath.
What I don't see in Woofer's curves is the sharp increase in current when this occurs. It would be nice to have Voltage, Current & Acceleration all synchronised.
________________
There's loads of other stuff which I'd like to ask and comment about Woofers excellent 'real life' results but I have to get some beach bum issues out of the way.
Woofer, I hope you still have the parameters & conditions under which you did your 2 original tests on your DVC unit recorded.
Actually, the cone velocity which is directly proportional to spl, SI at 1m bla bla (ie what we hear) is the Integral of the acceleration waveform. You can't just divide by j*w unless the waveform is a single pure sinewave.
Velocity & Acceleration waveforms are not identical except for a single pure sinewave.
Good point(s). The driving voltage is a pure sine wave. At these large excursions, the current is about equal parts of fundamental, H2 and H3. I will see if I can get the scope to integrate.
The nipple points on the peaks are real.
What's happening is as the coil reaches the limits of Xmax (as measured by the coil length and the top plate), the amount of steel inside the coil drops and the instantaneous Inductance drops drastically. This leads to more instantaneous current. It is an unstable phenomena and the coil tries to jump out of the gap and/or hit the backplate.
The upgraded rig will have an amp that forces current. No jump in instantaneous current can happen then. It will be informative to see if the nipples go away.
The simple 'cure' is to let the spider & suspension start limiting. This is counter-intuitive as making the suspension limit actually reduces acoustic THD at these levels.
Don Barlow did a lot of work on this in the 70's. I don't think he published in AES but there was at least one Wharfedale Engineering Memo. I was privileged to work with Don, a true polymath.
What I don't see in Woofer's curves is the sharp increase in current when this occurs. It would be nice to have Voltage, Current & Acceleration all synchronised.
I will have all 3 on the scope within a couple of weeks with better current control.
In my opinion, the current is much too distorted (H1+H2+H3) to make any sense of anything. This is why I am obtaining a power transconductance amplifier. I wish the amp guru people here would design a really good one that I could build myself.
________________
There's loads of other stuff which I'd like to ask and comment about Woofers excellent 'real life' results but I have to get some beach bum issues out of the way.
Woofer, I hope you still have the parameters & conditions under which you did your 2 original tests on your DVC unit recorded.
The pictures have the settings of freq and amplitude so, yes, the settings are recorded. I actually let the speaker tell me where it wants to be frequency wise. The WTPro shows current/voltage phase in real time. I adjust the freq until I am within a degree or so of resonance while excursing at Xmax.
Thank you for the kind words and your interest.
Current Drive Measurements
Current=Blue
Voltage=Purple
Acceleration=Yellow
1A RMS, 19.8 Hz, 14.8V RMS, 14.86 ohms, 21.2V Pk, 31mm pk-pk excursion, 39.8G pk-pk acceleration

1.5A RMS, 17.2 Hz, 22.0V RMS, 14.73 ohms, 32.9V Pk, 44mm pk-pk excursion, 52G pk-pk acceleration

2A RMS, 16.35 Hz, 13.8 ohms, 27.45V RMS, 42.4V Pk, 70mm pk-pk excursion, 75.7G pk-pk acceleration

Current=Blue
Voltage=Purple
Acceleration=Yellow
1A RMS, 19.8 Hz, 14.8V RMS, 14.86 ohms, 21.2V Pk, 31mm pk-pk excursion, 39.8G pk-pk acceleration
1.5A RMS, 17.2 Hz, 22.0V RMS, 14.73 ohms, 32.9V Pk, 44mm pk-pk excursion, 52G pk-pk acceleration
2A RMS, 16.35 Hz, 13.8 ohms, 27.45V RMS, 42.4V Pk, 70mm pk-pk excursion, 75.7G pk-pk acceleration
Voltage Drive Measurements
Same colors as above
32.85V pk drive. 17.2 Hz. This are the same voltage and frequency as the current drive 1.5A rms current drive conditions. 46mm pk-pk displacement. Acceleration 55G pk-pk

42.4V pk drive. 16.35 Hz. This is the same voltage and frequency as the current drive at 2A rms current drive conditions. 83mm pk-pk displacement. Acceleration 90.3G pk-pk

Same colors as above
32.85V pk drive. 17.2 Hz. This are the same voltage and frequency as the current drive 1.5A rms current drive conditions. 46mm pk-pk displacement. Acceleration 55G pk-pk
42.4V pk drive. 16.35 Hz. This is the same voltage and frequency as the current drive at 2A rms current drive conditions. 83mm pk-pk displacement. Acceleration 90.3G pk-pk
Voltage Drive vs Current Drive
Here is a side by side comparison of voltage drive vs current drive.
Current drive ion the left.
Voltage drive on the right.

Here is a side by side comparison of voltage drive vs current drive.
Current drive ion the left.
Voltage drive on the right.
The above are just the facts. No opinions. The following are some observations.
1. pk-pk excursions are greater with voltage drive when looked at per-volt.
2. Acceleration under voltage drive has more discontinuities.
3. The speaker is more controlled under current drive.
Opinions
At the ends of excursion, it is obvious that the speaker is unstable under voltage drive. The negative acceleration peak under voltage drive is running away.
Woofer, can you conveniently put a couple of integrators on the output of your accelerometer?The above are just the facts. No opinions. The following are some observations.
1. pk-pk excursions are greater with voltage drive when looked at per-volt.
2. Acceleration under voltage drive has more discontinuities.
3. The speaker is more controlled under current drive.
Opinions
At the ends of excursion, it is obvious that the speaker is unstable under voltage drive. The negative acceleration peak under voltage drive is running away.
One integrator will give 'Cone Velocity' which is a measure of spl, sound intensity bla bla .. ie what we hear.
Two integrators would give 'Cone Excursion' which would let us see the instability more clearly.
Woofer, can you conveniently put a couple of integrators on the output of your accelerometer?
One integrator will give 'Cone Velocity' which is a measure of spl, sound intensity bla bla .. ie what we hear.
Two integrators would give 'Cone Excursion' which would let us see the instability more clearly.
Not conveniently. I will have to make such an animal on a proto board and try it out.
You can eyeball the results. The integral of an impulse is a step. The integral of a step is a triangle. The integral of a triangle is a parabola (x^2).
The overall shape of the 2 amp acceleration is a triangle accompanied by some local steps and impulses.
The velocity is in general therefore parabolic, x^2. This is why there is so much harmonic distortion when looking at a microphone capture which I have measured.
The parabolic velocity signal will have local steps and triangular slopes due to the local acceleration impulses and steps.
From a macro view, large signal velocity is dominated by the square law magnetic force vs distance law.
The local undulations are due to suspension and voice coil electrical behaviors.
The difference between the voltage drive and current drive signals show the behavior of the voice coil electrical issues under voltage drive.
I know all this Woofer, but my small brain has problems doing visual integration. There's loadsa gotchas like the change of sign of the acceleration signal.You can eyeball the results. The integral of an impulse is a step. The integral of a step is a triangle. The integral of a triangle is a parabola (x^2).
The overall shape of the 2 amp acceleration is a triangle accompanied by some local steps and impulses.
The velocity is in general therefore parabolic, x^2. This is why there is so much harmonic distortion when looking at a microphone capture which I have measured.
The parabolic velocity signal will have local steps and triangular slopes due to the local acceleration impulses and steps.
If you are designing a special unit (which I think you are) you really need to look at the Displacement carefully. The 2 integrators is a good way.
It was circa 1980 but IIRC, I don't see what I remember from my own experiments on a much smaller unit.
- Home
- Amplifiers
- Solid State
- Current drive for Loudspeakers