yes anything to do with the build i can provide . as i reversed engineered everything myself. give me an hour or so ill pull all my files and drawings send over to you..So far the results look reasonable to me. Once I have a model of the tweeter's response, then we can proceed further. These models don't include any baffle difraction step at this stage. Can you provide a drawing of the front baffle with dimensions showing the locations of the drivers?
When the access violation errors happened to me, I thought that I noticed that the gain was changed on one of the channels. It's all a bit odd, but I suppose that it could occur if something was overwritten in memory with spurious data from somewhere else.Hypex seems to be a very twitchy bit of software. I to get the same violation errors, i dont take any notice of them.

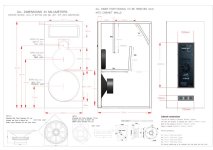
So these are the original plans that i used to reverse engineer the pmc mb2s xbd.. Like i said before , i am good at building but when its comes to tech stuff ,, not to good.. i had the mid driver mount CNC out of aluminium , i had to customize that as well .. baff is 32 mm high density MDF
Attachments
Last edited:

Are ATC good monitors? Made in Germany I think and have the pro price tag.I have used many studio monitor, My last ones were Genelec 1033a i used for mastering, great speakers but not up to the job today. So this is why i do alot with my trusted ears,,
@Amami Life After a few false starts and some modelling errors along the way, I have managed to learn how to use HFD. I believe that I am now getting some reasonable results out of my simulations, which I will share below.
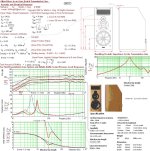
Please be aware that all of these simulations make use of minimum-phase driver models created by VituixCAD. To improve the overall accuracy, it would be necessary to use measured data of each of the drivers mounted in the enclosure. However, the results I will present will hopefully be a reasonable first approximation to a complex case.
The frequency response data for each of the three drivers (Volt woofer, Volt midrange, and ScanSpeak tweeter) was obtained by curve-tracing the frequency response plots published by the manufacturer in each driver's datasheet. VituixCAD does that very well, and it also produces the required minimum-phase approximation to the driver's phase response. The phase response is critical to the viability of the entire modelling process.
Once I had all of the required frequency response data, I then used VituixCAD's "Impulse response" function to convert the frequency response data to time-domain impulse response data. The sampling rate of 93750Hz required by HFD was used during the transformation of the data from the frequency domain to the time domain.
With a bit of adjustment to the Gain settings on the midrange and the tweeter, the summed response falls within ±2dB limits around a mean level of around 7dB in the plots presented below.
Below is a HFD plot of the woofer's raw and filtered responses in HFD, together with the summed response:

Below is a HFD plot of the midrange's raw and filtered responses in HFD, together with the summed response:

Below is a HFD plot of the tweeter's raw and filtered responses in HFD, together with the summed response:

Please be aware that all of these simulations make use of minimum-phase driver models created by VituixCAD. To improve the overall accuracy, it would be necessary to use measured data of each of the drivers mounted in the enclosure. However, the results I will present will hopefully be a reasonable first approximation to a complex case.
The frequency response data for each of the three drivers (Volt woofer, Volt midrange, and ScanSpeak tweeter) was obtained by curve-tracing the frequency response plots published by the manufacturer in each driver's datasheet. VituixCAD does that very well, and it also produces the required minimum-phase approximation to the driver's phase response. The phase response is critical to the viability of the entire modelling process.
Once I had all of the required frequency response data, I then used VituixCAD's "Impulse response" function to convert the frequency response data to time-domain impulse response data. The sampling rate of 93750Hz required by HFD was used during the transformation of the data from the frequency domain to the time domain.
With a bit of adjustment to the Gain settings on the midrange and the tweeter, the summed response falls within ±2dB limits around a mean level of around 7dB in the plots presented below.
Below is a HFD plot of the woofer's raw and filtered responses in HFD, together with the summed response:
Below is a HFD plot of the midrange's raw and filtered responses in HFD, together with the summed response:
Below is a HFD plot of the tweeter's raw and filtered responses in HFD, together with the summed response:
Wow you have gone way beyond what I expected “ i am extremely grateful for your support and kindness. I will endeavor to continue the work at this end and give you as much feedback as possible. There maybe a bit of delay in my response due to time difference here in Japan but I’m on it . I’ll check everything out very soon as I am out and about at the moment,, cool . thanks again 🙏With a bit of adjustment to the Gain settings on the midrange and the tweeter, the summed response falls within ±2dB limits around a mean level of around 7dB in the plots presented below.
And a little update. I've gone and tuned the design. This involved changing the LPF cutoff frequency on the woofer, and the HPF cutoff frequency on the tweeter. I also added a few EQ sections here and there to smooth out the response. I was careful to only apply rather broad adjustments, as I wanted to maintain the inherent qualities of each of the drivers.
Below are the results, with the summed response falling within ±1dB limits, clearly demonstrating what can be achieved through the judicious application of DSP.
Woofer response:

Midrange response:

Tweeter response:

Below are the results, with the summed response falling within ±1dB limits, clearly demonstrating what can be achieved through the judicious application of DSP.
Woofer response:
Midrange response:
Tweeter response:
So I have come back home to view everythng on my PC , I can definitely say its not what I exspected. I have 100% been going about this all the wrong way , I think i have been using the filters more like a custom EQ , becouse I am a mastering and mixing eneineer I guess ive looked at it that way,, if you need to send me any of the HPF Files please send to my email box,, So moving forward , what would be our next move ? By the way you can call me dom.And a little update. I've gone and tuned the design. This involved changing the LPF cutoff frequency on the woofer, and the HPF cutoff frequency on the tweeter. I also added a few EQ sections here and there to smooth out the response. I was careful to only apply rather broad adjustments, as I wanted to maintain the inherent qualities of each of the drivers.
Below are the results, with the summed response falling within ±1dB limits, clearly demonstrating what can be achieved through the judicious application of DSP.
One of the limitations of the above simulations is that they aren't based on actual measurements of the drivers taken when they are mounted on the baffle. Noting that the tweeter is centrally located, it can be expected to be influenced by diffraction effects from the nearby cabinet edges.
You might consider placing some felt or other type of acoustic absorption material around the tweeter so as to reduce the intensity of diffraction effects. Something like that shown below might help to get the full, unadulterated sound of the ScanSpeak D2606-922000 to your ears.

Note the wedge-like triangular shapes in the internal area. These are similar in concept to the acoustic absorption wedges found in anechoic chambers, except that here they are of course much smaller due to the short wavelengths of sound produced by the tweeter. However, the use of such an approach will change the aesthetics of the loudspeaker system, which may not be to everyone's liking.
You might consider placing some felt or other type of acoustic absorption material around the tweeter so as to reduce the intensity of diffraction effects. Something like that shown below might help to get the full, unadulterated sound of the ScanSpeak D2606-922000 to your ears.
Note the wedge-like triangular shapes in the internal area. These are similar in concept to the acoustic absorption wedges found in anechoic chambers, except that here they are of course much smaller due to the short wavelengths of sound produced by the tweeter. However, the use of such an approach will change the aesthetics of the loudspeaker system, which may not be to everyone's liking.
Last edited:
Hello, I think you used FIR files. As my FA amps are older they will not load . Can you transfer them to an older version in the filter setup ? Thanks 🙏
So when I load the files you sent me “ when you go into the advanced menu click on the bottom right corner “ FIR files are showing’ on the software you are using I can also see on the TOP next to EQ in Red I see FIR . The software you need is the one below that one my friend. The one without FIR just EQ.
Attachments
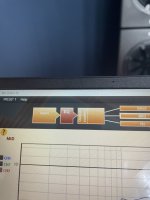
That's true. I'm using HFD Version 5.0, and I did click on the FIR button. However, no FIR files were loaded. In your case, you can safely switch that option off or ignore it, as it was never actually used. Sorry about that.
Hay , I can’t switch it off when I load it it’s there . I can definitely open the files and see your work exactly what you showed me “ but it won’t load my friend. Again I have the version without the FIR settings, if I try to update to a more recent version of HFD is won’t let me , like I said “ if I go the the advanced menu “ on the input stage a FIR box appears that’s how I know they are FIR files. I never have seen that before. When I reload with my old data file the FIR box disappears. Sorry to be a pain in the a** thanks again.
- Home
- Loudspeakers
- Subwoofers
- Crossover questions