I set up all my 4-way and 3-way builds active, and have done a good bit of measuring to see if shorting out adjacent drivers would effect measurements for the driver under measurement and tuning.
At low frequencies (sub to mid), I've found even shorting out doesn't dampen well enough to remove resonant spillover. I get subs far away from any mid section I'm tuning now.
At higher frequencies, (even as low as 650Hz mid to high that I use in most of my builds), I cannot detect any resonant spillover at all.
Out of interest in this thread, I just test a new coax I'm working on (15cxn88, a CD and 15" combo,) . It crosses at 1.2kHz and whether the cone is open, shorted, or shorted and physically damped, the CD response stays the same under zoom.
I know my builds/examples are miles away from the drivers under discussion, but I think the acoustic principle is the same. Is there resonance between drivers or not?
I just can't see how any significant resonances could be introduced into the breakup region of the lower driver by the higher driver, at anything above very low-mid frequencies. Would love to see some measurements to prove this wrong though ...
IME cone break up is a major contributor to the characteristic sound of a driver. When a cone breaks up it essentially rings and produces a sonic fingerprint that lets you know what its made of.
Yep, but all of it can be dealt with. In mid/woofers often the low pass filter does this quite handily. I have heard, but not verified, that in tweeters with resonances >= 20kHz dealing with this notch can reduce in-band (< 20 kHz) distortion products.
I mean, as designers I think we get into the habit of designing the low pass filters so that the cone break-ups are already attenuated pretty well. The use of simulations to fine-tune a notch filter to take out anything left over is a real godsend.
Best,
E
OK, but I'm not sure the effects of breakup have otherwise been made clear. ie, what are we looking at?I'd personally like to see plots instead of just discussion.
Fair enough, but I can see this limiting the result to resonances while excluding the spatial anomalies of a breaking up cone, and limiting the effect of the cone area alone on directivity, whilst including various horn related issues.Thus far, I've shown horn-loaded compression drivers because I generally don't deal with direct radiating drivers
Let's have a concrete example, rather than all this awful waffle then! 😀
Me and Dissi are currently trying to salvage an inept 6" plus 1" design in another thread. TBH, we are both winging it a bit, but are interested in polycones, which are famous for having very little breakup.
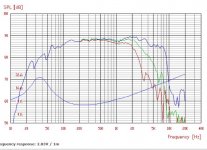
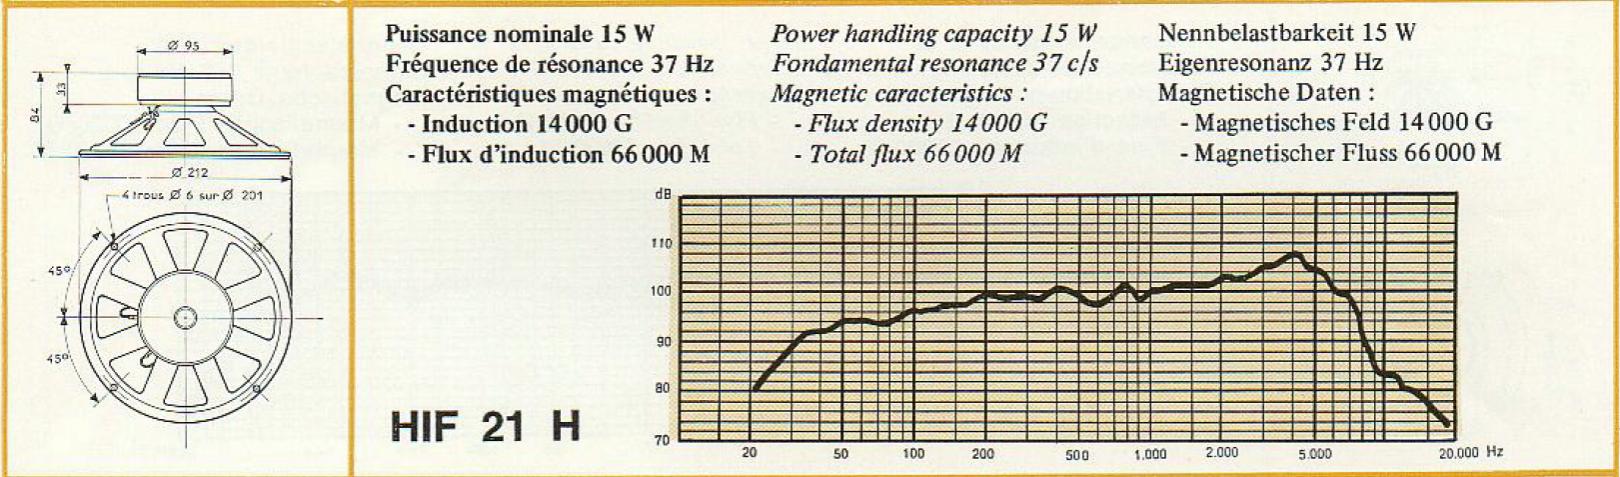
Dissi is pretty good at this sort of thing. It is using the famous old Vifa P17WJ-00-08 polycone, Vifa's FR is below. TBH, you've got to be pretty clueless to get a bad result with such a tidy driver. But the poster HAS succeeded in messing it up totally. 😱
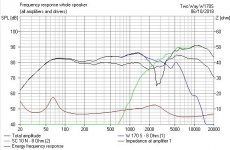
Here's what Dissi has got for the useless filter.
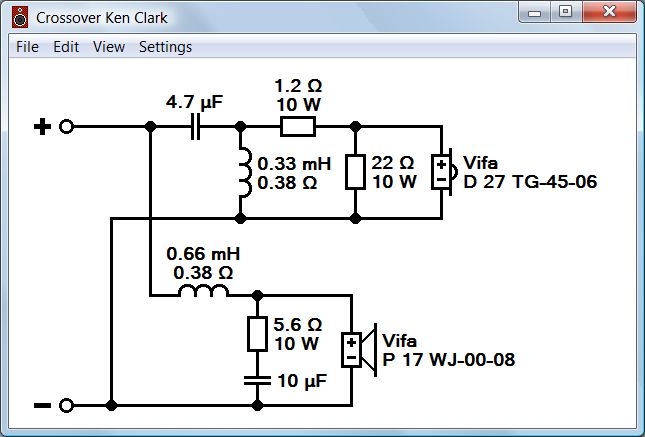
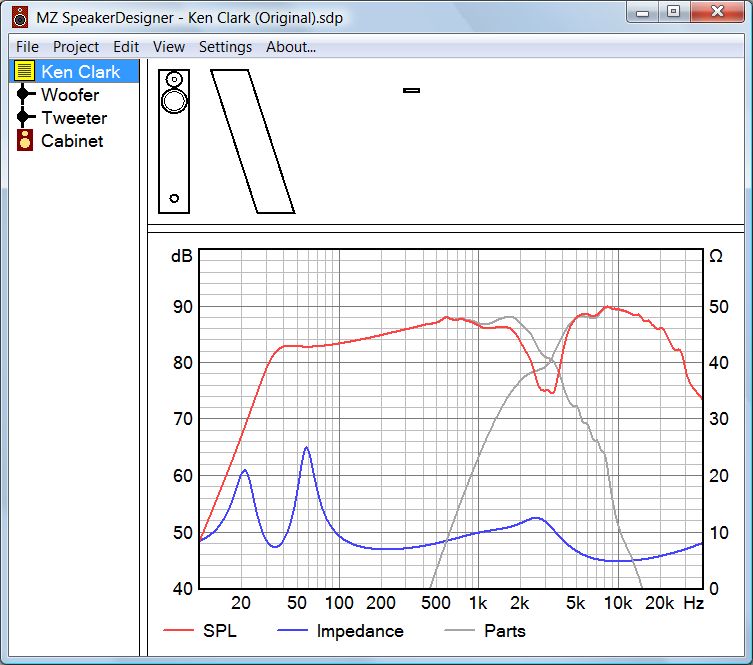
Below is what I get for the same dreadful filter with a 6" paper Visaton W170S cone. But you CAN see the paper cone has much more breakup at 5kHz. Either way, a bass filter with more bafflestep and rolloff is indicated. 😎
IMO, breakup notches are dubious things. I think there is a better way. But that's another topic.
Me and Dissi are currently trying to salvage an inept 6" plus 1" design in another thread. TBH, we are both winging it a bit, but are interested in polycones, which are famous for having very little breakup.
Dissi is pretty good at this sort of thing. It is using the famous old Vifa P17WJ-00-08 polycone, Vifa's FR is below. TBH, you've got to be pretty clueless to get a bad result with such a tidy driver. But the poster HAS succeeded in messing it up totally. 😱
Here's what Dissi has got for the useless filter.
Below is what I get for the same dreadful filter with a 6" paper Visaton W170S cone. But you CAN see the paper cone has much more breakup at 5kHz. Either way, a bass filter with more bafflestep and rolloff is indicated. 😎
IMO, breakup notches are dubious things. I think there is a better way. But that's another topic.
Attachments
OK, but I'm not sure the effects of breakup have otherwise been made clear. ie, what are we looking at?
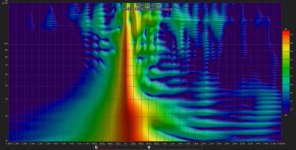
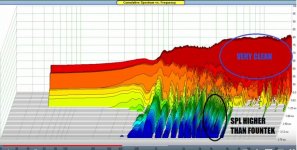
You didn't see this? Look at the ~3-6 wavelength delay "slap" at 12-20 kHz, plus the degree of pre- and post-impulse chatter relative to the TAD TD-4002:
This is diaphragm breakup, or more accurately bending modes, that is significantly altering the desired output waveform as viewed in the time domain.
Chris
Attachments
Fair enough, but I can see this limiting the result to resonances while excluding the spatial anomalies of a breaking up cone, and limiting the effect of the cone area alone on directivity, whilst including various horn related issues.
Unfortunately, it's not the horn effects that's creating the breakup modes seen but rather diaphragm break-up modes.
This is also visible in the time domain while using horn-loaded cones instead of edge-loaded domed diaphragms. Direct radiating drivers undergoing diaphragm breakup effects also add amplitude and exaggerated frequency modulation distortion sidebands which significantly add to the muddiness of the sound outside of the break-up band(s).
Chris
Last edited:
On the basis of what aspect of the spectogram do you deduct is the diaphrapm only (so to speak) and not other aspects of the driver-horn combo?
I can see it is the same horm, but the geometry plus matching to the horn mouth cannot be disregarded as a potential source of trouble.
I can see it is the same horm, but the geometry plus matching to the horn mouth cannot be disregarded as a potential source of trouble.
Theoretically yes, that is exactly right. If you were the EQ the response back to flat, the CSD would be perfect too. This is difficult to accomplish with anything other than FIR filters however.@TMM: SPL are CSD are mathematically linked and differet ways of picturing the same data. One cannot have a perfectly flat SPL curve and a bad CSD. Thd is a different matter, but to what extent this is audible is a differnt matter.
Properly digitally equalized one should be able to remove the break up peak.
This, however, is not practical because the very cause of the frequency response deviating from flat is that the cone is breaking up and acting as multiple sources ringing out of phase.
The result is that you will never be able to perfectly correct a stiff/metal cone breakup on more than one axis, therefore, on some axes the breakup will be under or over compensated and the 'ridges' that you see in the CSD will still be plainly visible above the noise floor even when the on-axis response is near flat.
With the price/performance ratio of drivers available currently, avoiding using drivers in their breakup region is quite an economical and practical approach and avoids the requirement for needlessly complex system filtering.
Last edited:
Theoretically yes, that is exactly right. If you were the EQ the response back to flat, the CSD would be perfect too. This is difficult to accomplish with anything other than FIR filters however.
This, however, is not practical because the very cause of the frequency response deviating from flat is that the cone is breaking up and acting as multiple sources ringing out of phase.
The result is that you will never be able to perfectly correct a stiff/metal cone breakup on more than one axis, therefore, on some axes the breakup will be under or over compensated and the 'ridges' that you see in the CSD will still be plainly visible above the noise floor even when the on-axis response is near flat.
With the price/performance ratio of drivers available currently, avoiding using drivers in their breakup region is quite an economical and practical approach and avoids the requirement for needlessly complex system filtering.
I agree. Once a driver goes into breakup, it is finished. There is nothing in the way of useful output to be had. All you can do is roll off the breakup as much as possible.
I said earlier that 8" drivers breakup up at 3kHz. 6" at 5kHz. 4-5" around 7-8kHz. Even a fullranger does not defy this rule.
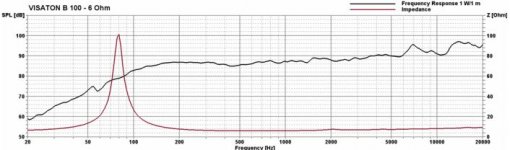
Visaton have recently introduced a rather splendid pricey 4" fullrange:
B 100 - 6 Ohm | Visaton
But I'd use that as a mid. You can see why it is problematic above 7kHz. The CSD shows the stored energy, aka breakup. More manufacturers should publish the waterfall, IMO. It is particularly revealing for tweeters, and often shows the useful crossover point below which things go to hell.
Attachments


On the basis of what aspect of the spectogram do you deduct is the diaphrapm only (so to speak) and not other aspects of the driver-horn combo?
I can see it is the same horn, but the geometry plus matching to the horn mouth cannot be disregarded as a potential source of trouble.
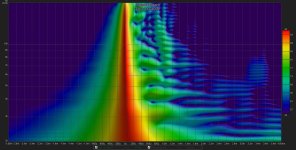
Again, I suppose you might take the position that it's the horn, but it seems more likely that you are simply not allowing yourself the opportunity to see that what is being described is actually occurring.
However...and once again for learning opportunity...look at the second spectrogram closely. It is the same horn measured from the same measurement location, levels, and configuration. The diaphragm doesn't break up because the material itself is roughly 6x better (a utility measure of the combined lightness and stiffness advantage) than the titanium in the first case. It's really difficult to look at the second spectrogram and claim "...It's the horn. It's the 'geometries'...but it's anything other than the most likely thing...", i.e., diaphragm bending modes.
There seems to be some sort of reader resistance to this information provided, which I'm at a loss to explain. Why would you continue to push measurements and plots that eliminate the time domain when looking for the difference between simple resonance and diaphragm break-up modes, i.e., Bode plots only?
I think it's much more than a very safe bet that what I'm describing (correlated to what I hear) is true and is the most likely and reasonable explanation for the 3-6 wavelength delay "slap". I know that since I've moved on from this observation, the ground that I've covered has been extremely productive. It has allowed me to look for drivers that don't have that characteristic--via measurements--and the resulting sound is a whole lot better.
Chris
...Once a driver goes into breakup, it is finished. There is nothing in the way of useful output to be had. All you can do is roll off the breakup as much as possible.
This has approximately been my experience, too. In order to avoid severe break up mode effects in driver diaphragms, I find that I have to move down in frequency about 1/2 octave lower and cross to another driver that's a lot more fit for purpose.
This of course is an issue once you get above about 1.5 kHz due to the fact that you're going to be vertically separating the two drivers (and horns if horn loaded) on the front baffle by a lot more than 1/4 wavelength, which introduces dual-source coverage distortions (i.e., an analog to the dual slit physics experiment from your childhood) and subsequent induced lobing.
But if the drivers used have been designed to control their bending mode transitions and resulting break-up mode amplitudes, the break up is still there but extremely difficult to hear.
Chris
moving down in frequency to avoid breakup modes does not seem correct to me...
doesn't potential distortion increase with larger displacement?
doesn't potential distortion increase with larger displacement?
Breakup in tweeter domes is well enough documented. Rigid domes in dustcaps do similar things.
Amazing that anybody has built good speakers at all, IMO. 😀
Apart from the Waterfall, the other indicator of breakup is the phase plot which also shows stored energy. You can see something rum is happening at 3kHz with this 8" paper driver:
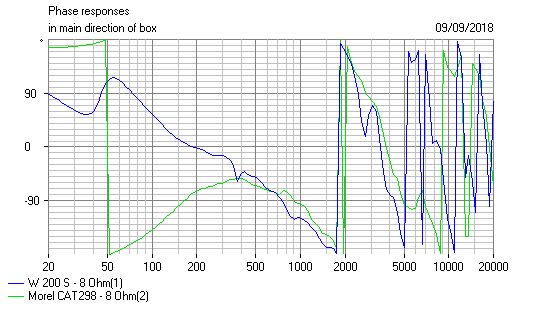
As TMM said, you can't just equalise it away, becasue simulators really don't know anything about all the bending modes of a cone or dome. And even if you do equalise it, the modes will be excited by distortion products from lower in the range.
If you take your beating on breakup, there are some designs which have done clever things, IMO. We are, after all, interested in what works.
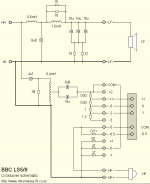
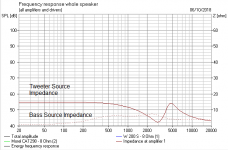
The BBC LS5/9 polycone/soft dome with 3kHz crossover was designed for an active filter. It never needed one, because the passive filter was so good. 😎
You've got to know what to measure to understand it. It's that the bass unit sees a very low source impedance anyway. This gives a little more control and damping than most bass filters. It also has a very flat impedance at the driving amplifier. Win-Win, IMO. 😀
Amazing that anybody has built good speakers at all, IMO. 😀
Apart from the Waterfall, the other indicator of breakup is the phase plot which also shows stored energy. You can see something rum is happening at 3kHz with this 8" paper driver:
As TMM said, you can't just equalise it away, becasue simulators really don't know anything about all the bending modes of a cone or dome. And even if you do equalise it, the modes will be excited by distortion products from lower in the range.
If you take your beating on breakup, there are some designs which have done clever things, IMO. We are, after all, interested in what works.
The BBC LS5/9 polycone/soft dome with 3kHz crossover was designed for an active filter. It never needed one, because the passive filter was so good. 😎
You've got to know what to measure to understand it. It's that the bass unit sees a very low source impedance anyway. This gives a little more control and damping than most bass filters. It also has a very flat impedance at the driving amplifier. Win-Win, IMO. 😀
Attachments

...Apart from the Waterfall, the other indicator of breakup is the phase plot which also shows stored energy. You can see something rum is happening at 3kHz with this 8" paper driver:
...you can't just equalise it away, because simulators really don't know anything about all the bending modes of a cone or dome. And even if you do equalise it, the modes will be excited by distortion products from lower in the range.
If you take your beating on breakup, there are some designs which have done clever things, IMO. We are, after all, interested in what works...
You've got to know what to measure to understand it...
I agree with the quoted, above. However, I've seen phase also related to non-breakup phenomena many times and for different reasons, so I tend to focus on the spectrogram and lingering "stored energy" over time. It's not difficult to see if you've got plenty of absorption around the driver to soak up nearfield reflections (or alternatively, you move outside to an elevated stand of suitably small reflective properties). I usually check the reverberation time ("RT60") plots (the T20, T30, EDT curves, etc.) to see if I'm actually getting direct arrivals and little or no reflections in the measurements. Sometimes you can get reflections off the spider and basket of the driver itself and those can look like break-up modes.
Chris
And I'd agree with you there. All those resonances which affect the time domain performance come from all over the place. The diaphragm, the surround, the spider, the magnet and voicecoil.
That is just the sum on axis in the far field of a 3D radiator. We do know that group delay is the differential of phase wrt frequency, so something useful is revealed.
One way to deal with breakup is to control it with cone damping, as in this splendid 8" Graham Audio LS5/9 polycone:
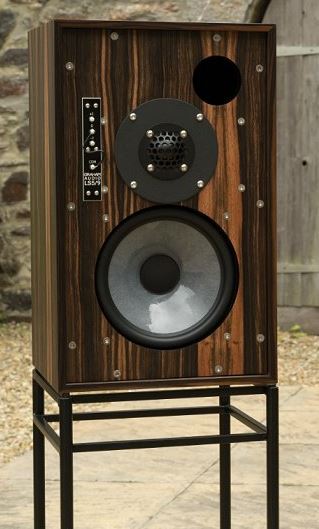
If you accept that distortion is a function of excursion and non-linear mechanical losses, this seems to work. I am sure it's not the liveliest or most detailed of sounds, but nothing offends on complex music like orchestra.
For us amateurs, it seems a good approach. That and steepish filters, which help reduce distortion.
I leave experienced people like Joachim Gerhard to do the metal cones. He has seriously good test equipment to push the envelope on resolution:
Sonics by Joachim Gerhard cabinets and kits.
I am currently trying out that BBC approach with an 8" Sony paper cone and a Morel CAT298 soft dome. I used to hate the Morel on a 2nd order, but I love it on a 4th order filter. It must control the Fs resonance better.
So far, so good.
That is just the sum on axis in the far field of a 3D radiator. We do know that group delay is the differential of phase wrt frequency, so something useful is revealed.
One way to deal with breakup is to control it with cone damping, as in this splendid 8" Graham Audio LS5/9 polycone:
If you accept that distortion is a function of excursion and non-linear mechanical losses, this seems to work. I am sure it's not the liveliest or most detailed of sounds, but nothing offends on complex music like orchestra.
For us amateurs, it seems a good approach. That and steepish filters, which help reduce distortion.
I leave experienced people like Joachim Gerhard to do the metal cones. He has seriously good test equipment to push the envelope on resolution:
Sonics by Joachim Gerhard cabinets and kits.
I am currently trying out that BBC approach with an 8" Sony paper cone and a Morel CAT298 soft dome. I used to hate the Morel on a 2nd order, but I love it on a 4th order filter. It must control the Fs resonance better.
So far, so good.
Attachments
Last edited:
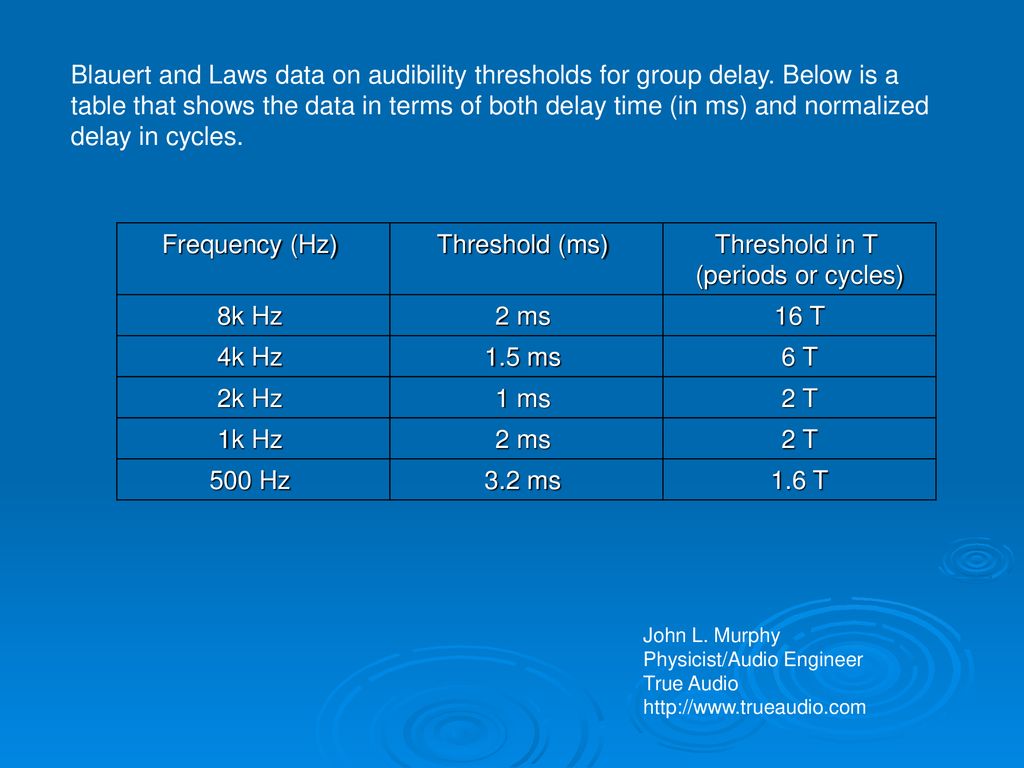
The magnitude of group delay deviations collapses with frequency, as well as the audibility of their effects (as per Blauert & Laws) but I've found that the audibility of diaphragm break up usually to be at a much lower threshold than the following chart indicates. Apparently diaphragm break-up involves more than just rate of phase change distortions, i.e., the type of time smearing inherent in diaphragm break up is not the same as group delay:
Last edited:
Well, perhaps not... I'm looking at some GD plots, and some of them are above the 2 ms threshold at 8 kHz.
What I've found however is that even very low values of GD above 10 kHz--associated with diaphragm break up--are quite audible. Perhaps it's the way that they're calculated, i.e., what is the timing reference with which to calculate phase/GD when there are multiple pulses due to diaphragm "ringing"?
Chris
I have no great theories about how much group delay is audible. I suspect the associated distortion is a much worse pest.
This video about ribbons is fascinating. I like Ryan and what he does in the Impulse Audio channel. YouTube
I think this is the video where he plays guitar to convince you 3rd harmomic distortion is much more annoying than second. IIRC, 3rd harmonic comes from asymmetric frequency response, but I might be wrong there.
But I just look at that $500 ribbon GRT 145 waterfall and say cross over above 4.5kHz! No brainer. 😀
FWIW, the GRT is unusual amongst ribbons in having a surround. Maybe that explains its rather good control at low frequency. Well, better than most ribbons.
Attachments
Last edited:
- Status
- Not open for further replies.
- Home
- Loudspeakers
- Multi-Way
- Cone break-up - how to quantify with measurements?