I built my loudspeaker system...
...this system is one of the most accurate and complete sounding systems in the world.
Wow! What a humble statement! ;-)
I'm happy for you that you feel your system is "one of the most accurate and complete sounding systems in THE WORLD" (emphasis my own) 😱. However, resonances like those tall ones you find from e.g. Seas L series drivers ARE problematic and here's why: Let's say you cross over low to AVOID the resonance. OK, that's a good effort. There will be little electrical energy input at the breakup frequency. I hope that the attenuation is already MUCH more (e.g. 12dB or more) than the height of the resonance peak at the resonance frequency. But the electrical input is not the only source of acoustic energy. The tweeter is probably right next to the bell-like alu cone, and it's not a bad source of energy input at e.g. 5kHz-7kHz. Remember, breakup is a mechanical resonance and acoustic energy input (from internal or external sources) can excite it.
IMHO tall resonance peaks really rule out some hard cone drivers for this reason. In more recent metal cone driver, manufacturers seem to have made a lot of progress towards reducing the magnitude of the breakup region resonances, and I would strongly prefer these drivers over earlier ones.
I appreciate your point of view but resonance which is excited mechanically is also inevitaly connected with driver inertia. If edge of the cone starts vibrating spontaneously, coil starts to move at opposite direction to the edge of the cone to preserve fundamental Newton's laws... This movement is quickly damped electrically inside of the motor.
If driver is not only crossed-over but properly notched-out as well, electrical energy at break-up frequency is proportionally lowered and issues with audioble resonance are removed. LR24 crossover at 1/3 break-up frequency results in 38dB attenuation of this problematic frequency. Additional 15 dB of notch-out attenuation will totally linearize driver's response across stop-band.
Regarding non-linear distortion from the motor. Metal-cone drivers are from the nature extremely low distorting units. From one particular example of driver I can only deduct the fact that nonlinearity peak at 1.5 kHz resulting from cone break-up is no higher than regular distortion profiles of many other soft-cone drivers.
Wow! What a humble statement! ;-)
Maybe you and CharlieLaub didn't notice that I did not use word "own"?
I noticed that many DIY'ers are affraid of cone break-ups like a fire. This is probably result of lack of knowledge and practice how to properly implement such a drivers.
The tweeter is probably right next to the bell-like alu cone, and it's not a bad source of energy input at e.g. 5kHz-7kHz. Remember, breakup is a mechanical resonance and acoustic energy input (from internal or external sources) can excite it.
I never thought of this but it does make sense, especially if you have the tweeter right next to the metal cone.
I suspect that the issue with metal drivers isn't the nonlinear or harmonic distortion. Some have distortion profiles similar to paper drivers.
The metal sound is probably the pattern of peaks in the FR that look like glass shards. The only way to avoid this is to only use them down low essentially as subwoofers.
Mark from markaudio made a similar statement about the jagged peaks of metal drivers.
.... However, resonances like those tall ones you find from e.g. Seas L series drivers ARE problematic and here's why: Let's say you cross over low to AVOID the resonance. OK, that's a good effort. There will be little electrical energy input at the breakup frequency. I hope that the attenuation is already MUCH more (e.g. 12dB or more) than the height of the resonance peak at the resonance frequency. But the electrical input is not the only source of acoustic energy. The tweeter is probably right next to the bell-like alu cone, and it's not a bad source of energy input at e.g. 5kHz-7kHz. Remember, breakup is a mechanical resonance and acoustic energy input (from internal or external sources) can excite it.
Also, as pointed out by TMM in his earlier post in this thread, some IMD will be LOWER in frequency than the breakup peak. These will be appearing in the low kHz region where the ear is pretty sensitive. There is no way to eliminate this distortion via the crossover or other means.
IMHO tall resonance peaks really rule out some hard cone drivers for these reasons.
In more recent metal cone driver, manufacturers seem to have made a lot of progress towards reducing the magnitude of the breakup region resonances, and I would strongly prefer these drivers over earlier ones.
I played a bit with modern alu cone drivers with fancy mechanisms for break-up elimination e.g. Kef R300 coaxial and with old school alu cone Seas L15RLY-P.
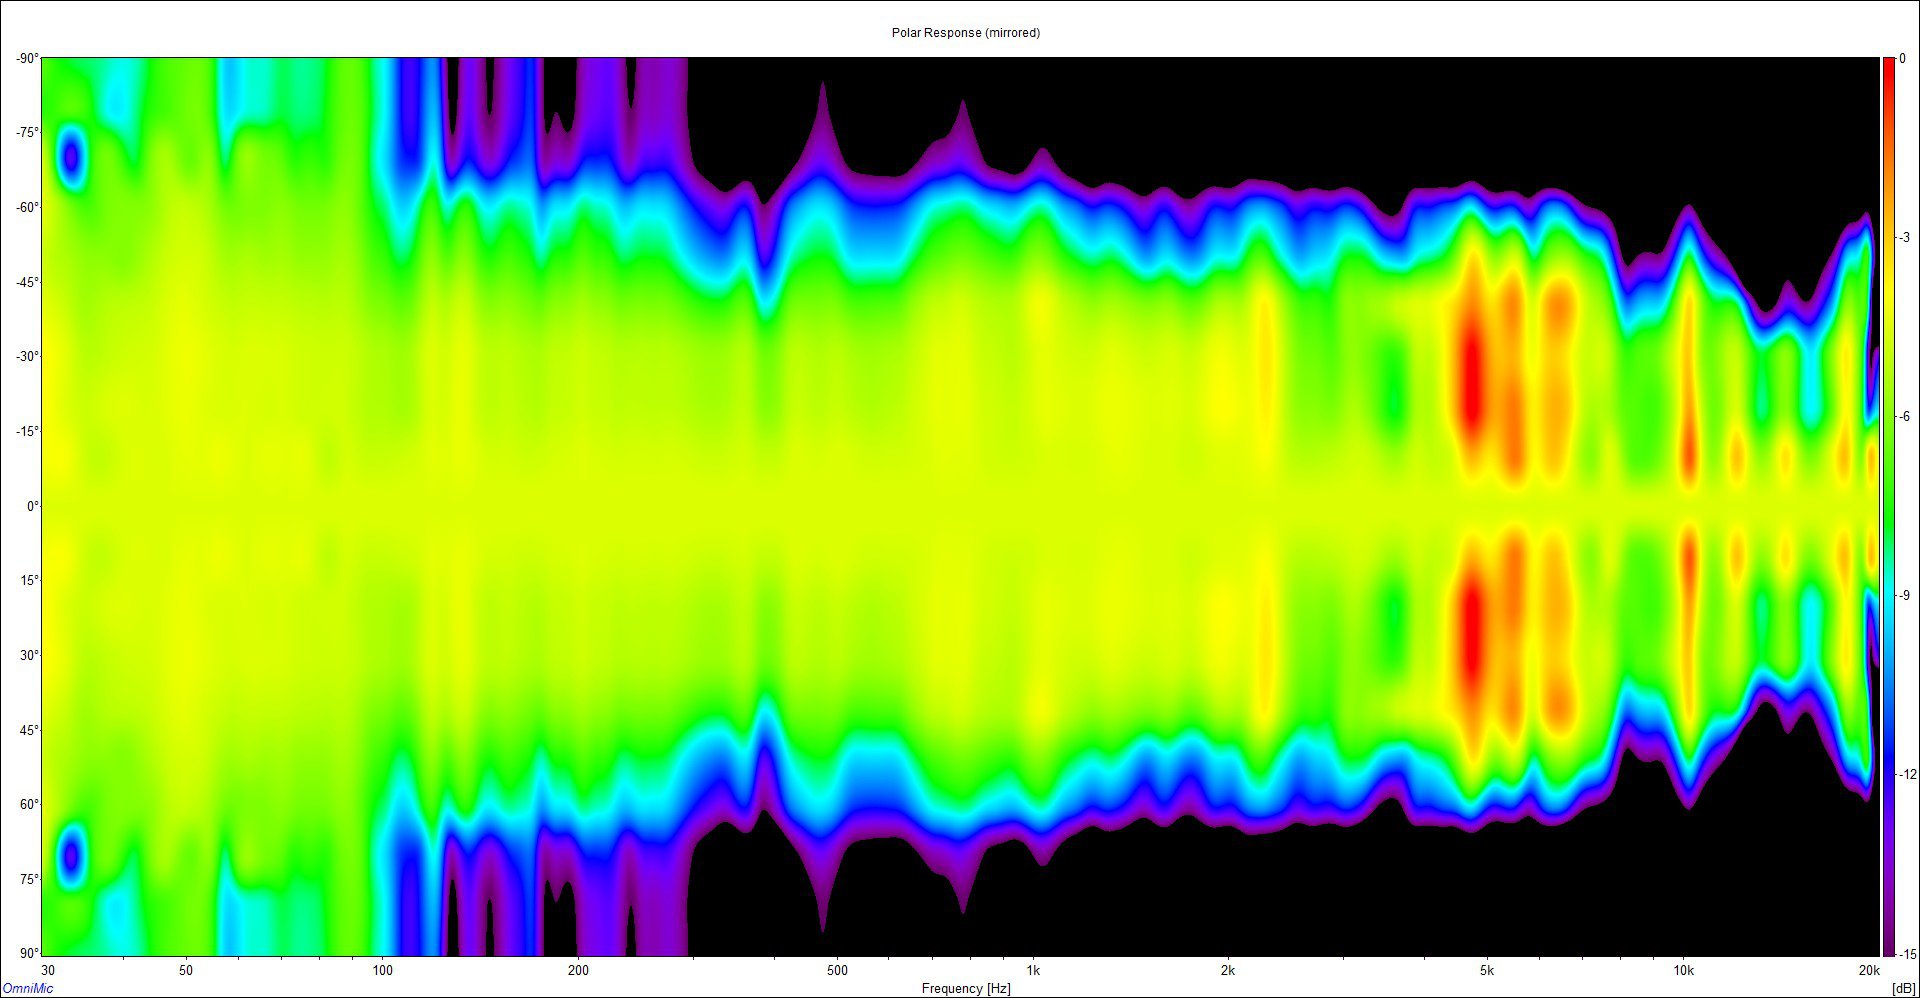
In Seas L15 thread you can see that at 8KHz (where the main break-up peak is) tweeter is at 90 degrees in regard to midwoofer and -20dB in level. I can provide frequency measurements with Logarithmic sine sweep and Square noise (excites 20Hz-20000Hz simultaneously unlike sweep) from HOLMimpulse. Seas L15 has such a violent resonance that it would have to show up on the frequency response if it was excited by an external source in any way - but it doesn't.
Comparing midrange tone from L15 to Kef R300 midrange was quite interesting. I could hardly pick any as better sounding. Kef has better power handling and digs deeper because of dedicated bass driver but as far as resolution and neutrality goes, there is nothing between them. Truth to be told, making the crossover for R300 midrange was fairly easy task - i'll give them that, L15 was a bit more complicated.
Regarding the distortion peaks lower in frequency - that distortion peak at 1300Hz in RS180-8 is -60dB below fundament. That is 0.1% and it is very narrow peak. I think i'd start to go to church again if someone could notice that while music plays. Most drivers have much higher 5th harmonic distortion than that and all over the frequency response - not just 100Hz wide area.
Last edited:
Consider the alternatives. The piston is larger here and reducing the sound power through directivity. The cone breakup is reducing it further through the higher order modes it creates. The axial response is going the other way, which may make the cross unsuccessful in a design where the axial response is important.Let's say you cross over low to AVOID the resonance. OK, that's a good effort. There will be little electrical energy input at the breakup frequency. I hope that the attenuation is already MUCH more (e.g. 12dB or more) than the height of the resonance peak at the resonance frequency.
Directivity measurements are the best way to quantify cone breakup, if your design requires it.
Allen, do you have an example to show of directivity measurements or polar sonogram showing the magnitude of diaphragm breakup (as opposed to simple resonance)? I believe that is the real question the OP posed.
If one had, say, a Klippel R&D test setup, using very close microphones across the mouth of a horn, or for direct radiators, across the diaphragm itself would be the preferred method, but I know of no DIYers that own such a setup.
Chris
If one had, say, a Klippel R&D test setup, using very close microphones across the mouth of a horn, or for direct radiators, across the diaphragm itself would be the preferred method, but I know of no DIYers that own such a setup.
Chris
After reading post 63 about the design of the dayton rs paper cones I had to order a pair of the 4 ohm ones, on sale too. RS150P-8 measurements -
Techtalk Speaker Building, Audio, Video Discussion Forum
Techtalk Speaker Building, Audio, Video Discussion Forum
Resonances in the pistonic region show up at all angles and will equalise without leaving anomalies in the directivity (not that there may not be other issues at the same frequency). Otherwise, detecting higher order modes or excessive lobing will indicate just that, and sometimes it will be useable. Drivers can often be nursed through the first breakup mode (usually below the larger peak), and that may get you to 90 degree dispersion. Apart from that I feel there is no reason to try to go higher unless doing a fullrange.Allen, do you have an example to show of directivity measurements or polar sonogram showing the magnitude of diaphragm breakup (as opposed to simple resonance)?
Plots?
I have some polar sonogram plots using a single type of compression driver with even worse diaphragm breakup issues then the K-691 that I posted earlier, but I haven't taken the time to also run with a driver that doesn't experience breakup (e.g., TADs or BMS dual diaphragm) so I can't show the relative effects of severity of breakup.
In general, I would say that the polar sonograms will show you the directivity issues, I wouldn't say that it shows the severity of the breakup. I've found empirically that the impulse spectrogram shows that quite clearly--the severity of non-pistonic motion--and that is in the time domain, which I've also found the human hearing system is most sensitive to.
An example in the horizontal orientation of the K-510 horn:
but the vertical direction doesn't show it nearly as clearly--just a widening of polars:
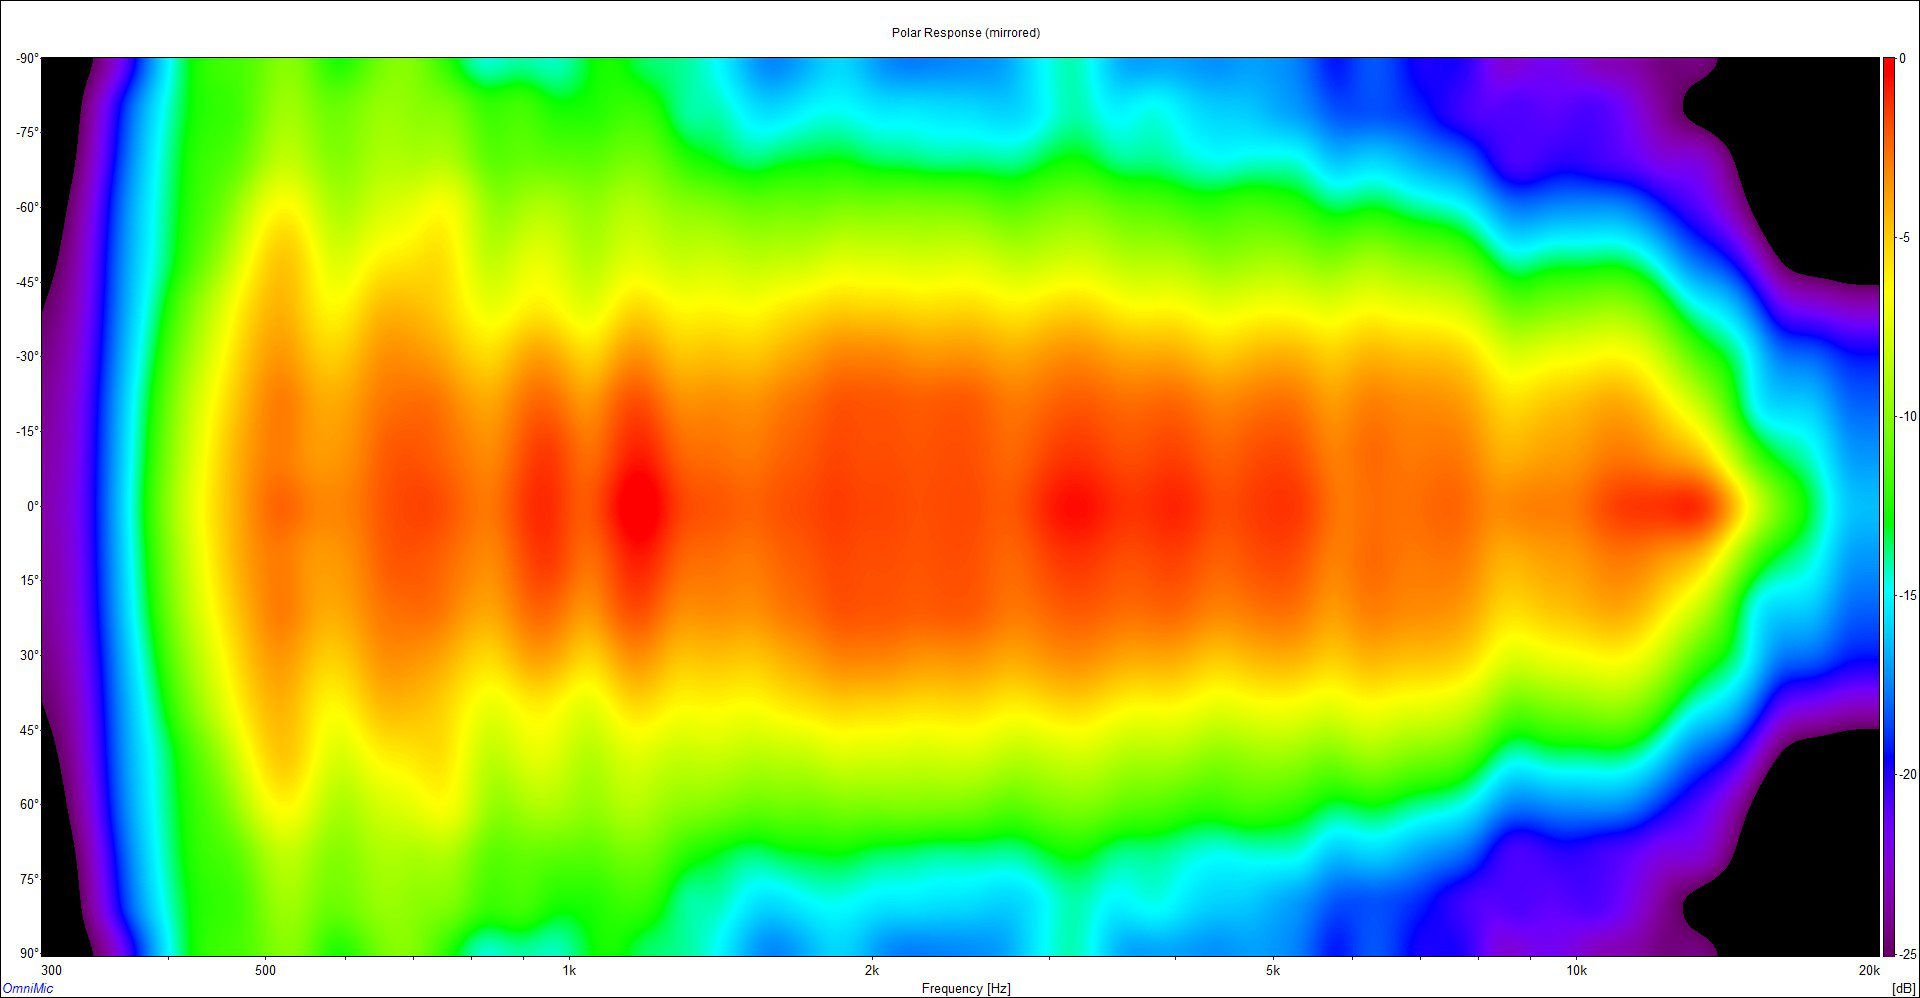
The same driver on another horn (ZXPC Chinese-sourced horn) doesn't show it at all:
I think that to show diaphragm breakup using only Bode plots is difficult, but using very close miked Bode plots spaced along the radial direction of the diaphragm or horn will eventually show the breakup vs. simple resonance, but it is much more difficult and time consuming to accomplish the measurements, as well as more demanding of the test taker's skills and abilities, IMHO.
It only takes one measurement using the impulse spectrogram, in my experience.
Chris
I have some polar sonogram plots using a single type of compression driver with even worse diaphragm breakup issues then the K-691 that I posted earlier, but I haven't taken the time to also run with a driver that doesn't experience breakup (e.g., TADs or BMS dual diaphragm) so I can't show the relative effects of severity of breakup.
In general, I would say that the polar sonograms will show you the directivity issues, I wouldn't say that it shows the severity of the breakup. I've found empirically that the impulse spectrogram shows that quite clearly--the severity of non-pistonic motion--and that is in the time domain, which I've also found the human hearing system is most sensitive to.
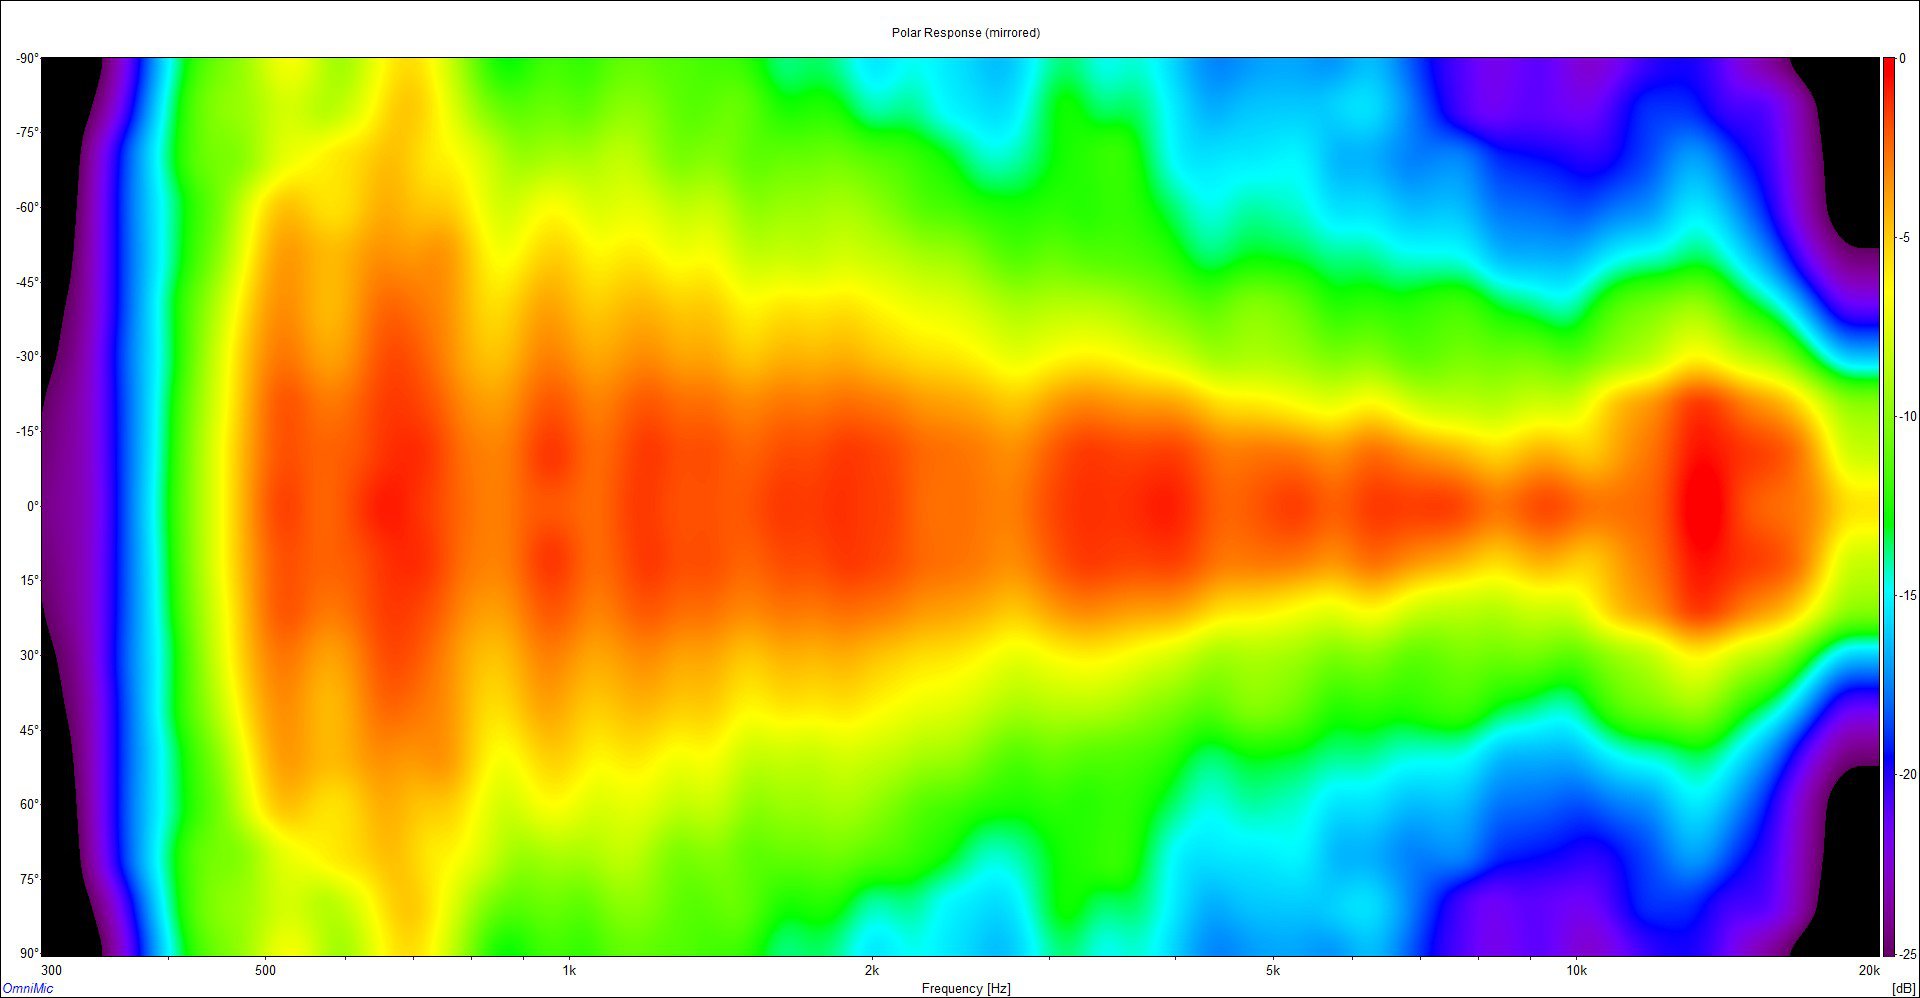
An example in the horizontal orientation of the K-510 horn:
but the vertical direction doesn't show it nearly as clearly--just a widening of polars:
The same driver on another horn (ZXPC Chinese-sourced horn) doesn't show it at all:
I think that to show diaphragm breakup using only Bode plots is difficult, but using very close miked Bode plots spaced along the radial direction of the diaphragm or horn will eventually show the breakup vs. simple resonance, but it is much more difficult and time consuming to accomplish the measurements, as well as more demanding of the test taker's skills and abilities, IMHO.
It only takes one measurement using the impulse spectrogram, in my experience.
Chris
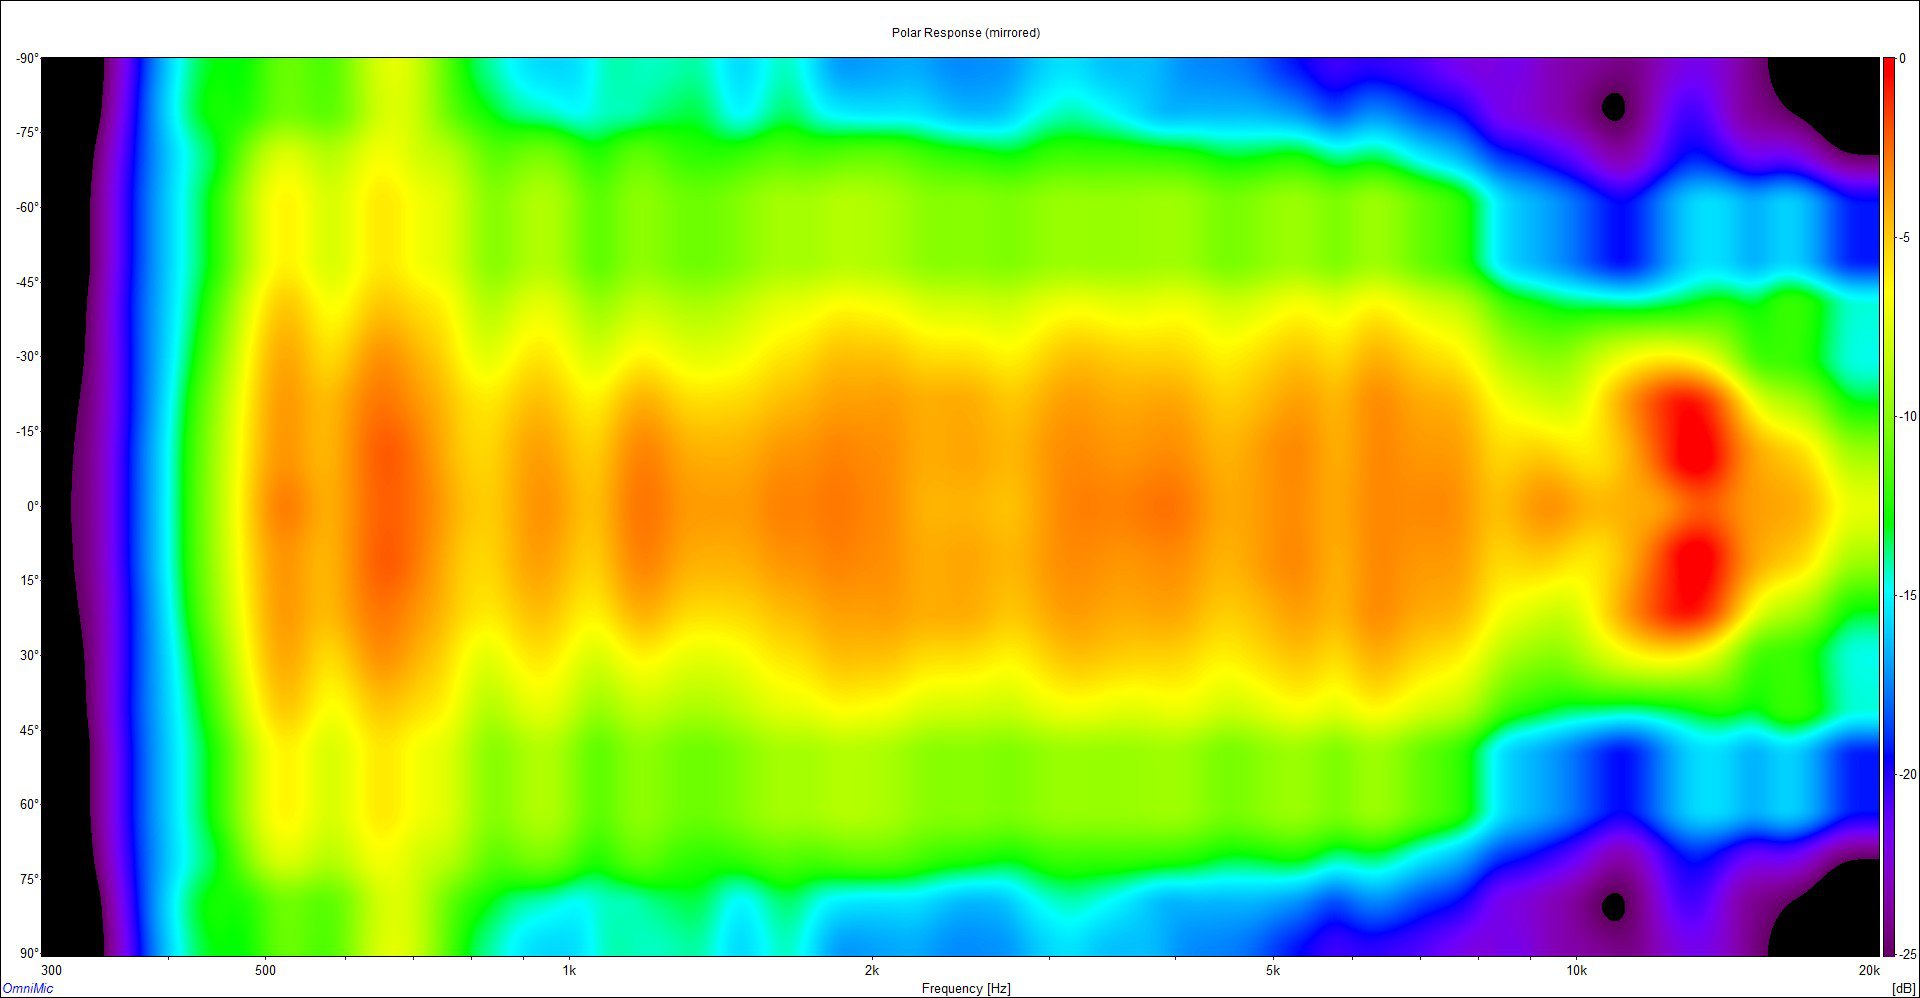
Here is the same information using the same type driver, but this time using a K-402 horn (with added woofer ports in a MEH configuration) in the horizontal orientation. It also doesn't show the break up:
and the same data used in a polar sonogram:
Chris
and the same data used in a polar sonogram:
Chris
Last edited:
These plots do show certain issues, for example where angular response plots cross over each other, polar plots with diagonal features, axial holes.
Maybe this is a case where it would be useful to (also) normalise the plots, simply because there are multiple issues coming from breakup. I'm not specifying an angle, whatever shows the effect best.
Maybe this is a case where it would be useful to (also) normalise the plots, simply because there are multiple issues coming from breakup. I'm not specifying an angle, whatever shows the effect best.
The last plots are normalized to the on-axis measurement. I've found that sometimes you don't want to normalize to the on-axis measurement but rather slightly off-axis by about 5 to 10 degrees--sort of like Toole describes in his book.
I'd personally like to see plots instead of just discussion. Thus far, I've shown horn-loaded compression drivers because I generally don't deal with direct radiating drivers with their much higher modulation and compression distortion issues (as well as changing coverage angle vs. frequency).
A plot is worth a whole lot of words in my experience. But discussion of how you did the measurements is also important to capture as well. The above K-402 plots were done on an elevated stand outside (on live grass) with a swivel base, and the microphone 1 metre from the horn mouth, generally on axis, but not exactly in order to avoid "mouth bounce" cancellations.
Chris
...... The tweeter is probably right next to the bell-like alu cone, and it's not a bad source of energy input at e.g. 5kHz-7kHz. Remember, breakup is a mechanical resonance and acoustic energy input (from internal or external sources) can excite it.
I am currently "battling" a 3 way design with Seas almost all metal drivers - L26RFX/P (W), L15RLY/P (M), 27TDFC/G (T)
I had not considered the L15 being excited by the surrounding drivers.
I am finding certain tracks / instruments / mixes intolerable in the sensitive 2.5 - 4KHz area.
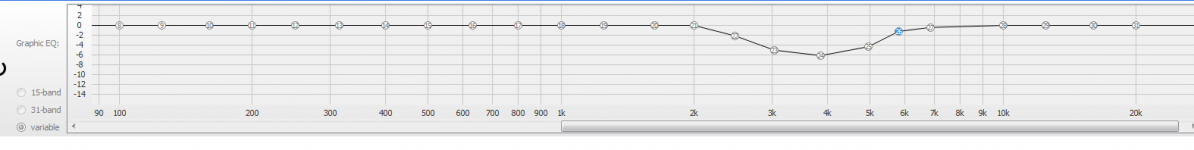
The attached equaliser setting makes these tracks listenable again - but obviously sacrifices detail / "balance" in that area (excuse poor terminology).
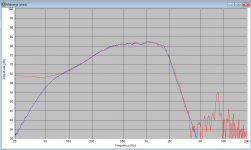
I am not convinced my L15 notch filter is working as shown by the sim'd (blue curve) and actual (red curve) measurement.
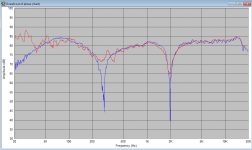
the 3rd attachment indicates reverse null (XO) points for my LR2/LR4 design if you are interested. Please note - the curve is not my target flat on axis response since I don't have the desired XO component values handy to achieve the target whilst maintaining inphase targets.
Off-axis curves are too be measured and posted when time allows.
Playing the tweeter alone surprisingly provides the harshness which is why I was interested in the excitation concept of the L15 which is smack bang next to the tweeter.
Attachments
I had not considered the L15 being excited by the surrounding drivers.
When I read the statement by Charlie Laub about exciting woofer resonances by tweeters I wasn't convinced that this happens with significant impact. Is there any study he can point to, did he do measurements or was it just a "thought experiment" ? Just Keep in mind that the forces caused by soundwaves from a tweeter are lower than the forces applied by a tweeters voice coil by some orders of magnitude .
Regards
Charles
Enough of a study would be to do a gated measurement of tweeter with midwoofer cone damped (some damping material, foam or poly, behind the midwoofer cone between cone and basket to restrict the cone movement and absorb the energy) and then do the same with midwoofer cone undamped.
Any difference between that two measurements would be the influence of midwoofer cone resonance excitement.
Any difference between that two measurements would be the influence of midwoofer cone resonance excitement.
Last edited:
The easiest way to prove this revelation to me is to do measurements using following methodology:
1. Disconnect woofer from amplifier and crossover network which is used for measurements leaving its terminals open.
2. Put the mic as close to the cone surface as possible. In fact, it should be nearly touching it. Chose cone edge opposite to the tweeter where it is better angled and coupled to the power radiated from the tweeter.
3. Set circa 1 ms rectangural gate of IR in order to exclude tweeter direct radiation influence on measurement.
4. Do a long sweep on tweeter. Level should be set high.
5. Short driver's terminals and repeat measurements.
6. Connect driver back to the system and do a long sweep as usual.
7. Find differences and post it here.
Good luck.
Last edited:
I didn't mention - midwoofer disconected from the crossover the whole time - i presumed it goes without saying.
And also not too much damping material for movement restriction behind the cone because the cone might be pushed more outwards than without damping material and that could influence the diffraction a little bit.
Enough of a study would be to do a gated measurement of tweeter with midwoofer cone damped (some damping material, foam or poly, behind the midwoofer cone between cone and basket to restrict the cone movement and absorb the energy) and then do the same with midwoofer cone undamped.
Any difference between that two measurements would be the influence of midwoofer cone resonance excitement.
And also not too much damping material for movement restriction behind the cone because the cone might be pushed more outwards than without damping material and that could influence the diffraction a little bit.
Last edited:
In order to approximate a real-life situation the woofer shouldn't be disconnected from the crossover but the woofer branch of the crossover should be disconnected from the amplifier and be shorted at its input. Just my 2 Cents.
Regards
Charles
Regards
Charles
In order to approximate a real-life situation the woofer shouldn't be disconnected from the crossover but the woofer branch of the crossover should be disconnected from the amplifier and be shorted at its input. Just my 2 Cents.
Regards
Charles
Right, I always forget that still there are passive systems which are trying to deal with such drivers. In order to properly conduct experiment and to proof real-life existence of imaginative problem described above, accourate, comprehensive and comparative set of measurements should be performed in order to quantity external condition's influence on acoustically-induced cone break-up resonance to proof the problem even exist or not.
- Status
- Not open for further replies.
- Home
- Loudspeakers
- Multi-Way
- Cone break-up - how to quantify with measurements?