QSPICE lets me do sweeps .ac dec 1K 1 100K but anything more gives weird errors such as can't find 2SC5200 model and Q5 is facing wrong way... All part of the learning process.I'm not seeing the problem you displayed in post #1

Agh - I forgot to add add the AC value to V in!
Solved.
Is 240mV from driver to pwr trans too high?
Cheers
Solved.
Is 240mV from driver to pwr trans too high?
Cheers
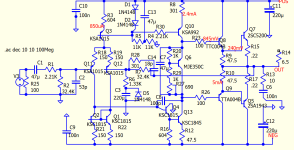
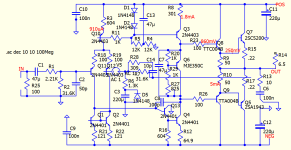
For now I'm still using .ac dec 10 10 100Meg for QSPICE and probing nodes OUT and NFB return to the LPT.
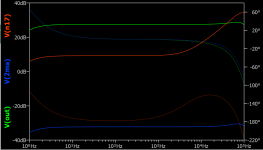
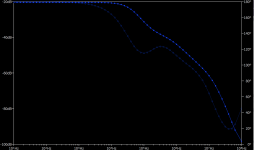
Along 0 degrees reads 70; middle plot starts to drop from 15 kHz and at 50kHz is down by -3.5dB
In order to keep R18 uA lower at than at R19, the res value of 604 ohms at foot of VAS remains lowish as a more typical 1K dropped R18 too much.
Can I ask is this closer to a reasonably good point for further development?
Cheers
Attachments
@Terry2000 maybe you have explained it earlier, but how are you doing the signal insertion to measure the OLG? That looks more like a CLG graph to me.
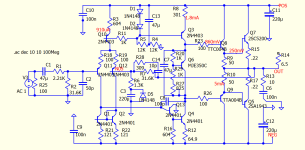
That's not the correct way of doing it. You need to insert an AC source right before the negative input of of the LTP. If we call the feedback line FB and the negative input NEG_IN, the quantity you want to plot is -V(FB)/V(NEG_IN). Let's call that magnitude A and the phase P. Look at for the point where A=0dB. Read the phase (it should be a negative number). Your phase margin is 180+P.For now I'm still using .ac dec 10 10 100Meg for QSPICE and probing nodes OUT and NFB return to the LPT.
Here's an example from a project I'm working on. Notice V4 in the middle? I'm also attaching the ASC file.
Attachments
Thanks for reading and replying. If I've measured it correctly my margin is 30 degrees so I at least know this isn't worth building.That's not the correct way of doing it. You need to insert an AC source right before the negative input of of the LTP. If we call the feedback line FB and the negative input NEG_IN, the quantity you want to plot is -V(FB)/V(NEG_IN). Let's call that magnitude A and the phase P. Look at for the point where A=0dB. Read the phase (it should be a negative number). Your phase margin is 180+P.
Here's an example from a project I'm working on. Notice V4 in the middle? I'm also attaching the ASC file.
Cheers
Using KSA992 I have measured 65 degrees margin as Cabrio reported. I guess the circuit has promise.
Cheers
Cheers
I don't think you measured correctly. You MUST break the FB loop to measure OLG. Try the method I just showed you.
That was a new method to me. How does that differ from just inserting an AC source and plotting -V(FB)/V(NEG_IN)?
Did you insert a voltage source like I did? You can't just break the loop.With loop broken (file attached) I can't see where A can be plotted at 0 dB
I read up a bit on the Tian method that @cabirio suggested and it's probably superior to what I'm using (which is a bit dated). Did you ever try that? The measurements I've seen from you so far seems to have been just comparing output to negative feedback, which I don't think will work. But I may have missed something.
Yep, inserted.Did you insert a voltage source like I did?
It is perfectly possible that I don't get the jargon used. Open loop and closed loop, for example, and I'm doing the wrong thing. For closed loop I leave the NFB attached to OUT / open loop - I detach it. This may be wrong - I don't see how the V source is going to be of any use with NFB detached! Likely my misunderstanding.
I tried the Tian approach. It's fairly similar to the simple AC voltage source method. For eyeballing the phase margin, the AC source method is probably good enough

The probe is placed at the NEG_IN left of the AC source. Screenshots attached.Can you post a screenshot?
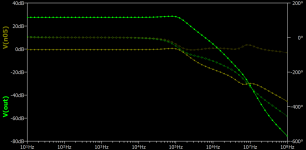
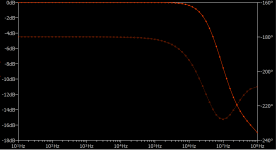
Strong red plot 0dB = -160 / lower faint red = -180
It doesn't resemble plots made with LTSpice
Thanks for the help to date.
Cheers
Attachments
A single probe won’t do. You need to plot the expression v(fb)/v(neg_in).
This video tells you all you need to know. https://www.analog.com/en/resources/media-center/videos/5579254320001.html
This video tells you all you need to know. https://www.analog.com/en/resources/media-center/videos/5579254320001.html
Many thanks. I do some digging to find how to add an expression to QSPICE...it uses different jargon (attributes, directives, other) in its GUI.You need to plot the expression v(fb)/v(neg_in).
- Home
- Amplifiers
- Solid State
- Bode plot reveals instability - solution advice sought