They have many models.I thought they only had the APx555.
I'm pretty sure the SYS-24xx and 25xx came before the 27xx. The 27xx is the higher spec'ed model. I don't remember if they were still selling the 27xx when I bought the APx525 in late 2014. They might just have included the 2722 in the plot as a comparison point to sell the APx555.I cannot find any documentation regarding the performance of a 2722 vs. 2522. I am wondering if they were different like in this case, they would have published it, but I am not sure. 2722 was too expensive and I don't know what benefits it would have offered.
The current version of the APx555 is the APx555B. It's a smidge better than the original APx555 but apparently not enough to warrant a new model number. The B version has a black front bezel. That's the version I have.
Anyway. The 25xx is a very capable box. Learn to use it.
Tom

believe or not but you got H3 -110db as I said, isn't it? FYI, ere is the pdf with notch measurements of 2722, 555, s1 AGens. https://www.nanovolt.ch/resources/oscillators/pdf/low_distortion_oscillator_comparison.pdf
Tom,Because it is... The SYS-27xx was the state of the art at one point. I'm thinking the APx525 (~$12k) was less expensive than the SYS-27xx. Then the APx555 came along and made the SYS-27xx obsolete. AP just discontinued support for the SYS2700-series.
I received this from AP when I was talking to them about these things.
View attachment 1348989
You can compare the performance of you 2522 with the plot above and find out. I suspect the 2722 is quite a bit better, but that's my guess.
I don't know if this generalizes to other AP models, but the performance of the APx525 is limited by the THD of the generator. So by filtering out the HD one can get down around -125 dBc THD (not THD+N!). I was able to measure near -140 dBc THD by then also notching out the fundamental from the DUT output. Unfortunately, I could not get it to work reliably across a wider range of voltages, so I ended up punting and getting the APx555 instead.
Tom
As I am getting more acquainted with the unit, I ran the same test shown on the brochure to compare models, on the 2522 to compare the performance,
As you can see it is pretty much a match with the 2722.
Maybe 2722 was improved vs 2522 with a sample rate(192k vs 96k) but the THD+N is nearly the same. At 2.5V (the sweet spot) mine reads -117.6db, AP 2722 commercial boasted -118db.

why don't I get this performance?believe or not but you got H3 -110db as I said, isn't it? FYI, ere is the pdf with notch measurements of 2722, 555, s1 AGens. https://www.nanovolt.ch/resources/oscillators/pdf/low_distortion_oscillator_comparison.pdf
My scan shows about -140dB noise floor. What am I setting wrong with the analyzer?
This is the pdf with EXTERNAL notch-filter measurements of 2722, 555, s1 AGens.
https://en.wikipedia.org/wiki/Band-stop_filter
https://en.wikipedia.org/wiki/Band-stop_filter
Maybe 2722 was improved vs 2522 with a sample rate(192k vs 96k) but the THD+N is nearly the same. At 2.5V (the sweet spot) mine reads -117.6db, AP 2722 commercial boasted -118db.
View attachment 1349049
wow this is a cool graph! I need to understand it better. Also the graph I posted before shows the matching with 2722 performance.
Maybe it's exactly like you said, the difference is the sampling rate, so it can go faster when processing the FFT and also should provide higher frequency FFT analysis.
I can notice that the AP2700 seems very much like the APWIN, is there any significant difference? I run APWIN if I want to run AP2700 I need to buy the external USB box.
With a notch(Cosmos APU, see attached) my 2522 has H3 -136db, and H2 <-150db, however, almost any modern DACs has better THD performance.

THD+N reaches -120db at 10V.

THD+N reaches -120db at 10V.
How do I select the notch filter on the AP? If I understand correctly this is the FFT of the 2522 gen out onto the COSMO ADC.
Could you please help me understand what do I need to set on APWIN to get this result?
Could you please help me understand what do I need to set on APWIN to get this result?
It is 2522 AGen, 1st screenshot is 6V, second one at 10V. ADC was mine indeed but you can get the same result even with your laptop 3.5mm audio input.
The notch was EXTERNAL device, nanovolt.ch also used external notch filter.
The notch was EXTERNAL device, nanovolt.ch also used external notch filter.
gptcha. So why can I not get that result when I process the FFT through the AP?It is 2522 AGen, 1st screenshot is 6V, second one at 10V. ADC was mine indeed but you can get the same result even with your laptop 3.5mm audio input.
The notch was EXTERNAL device, nanovolt.ch also used external notch filter.
This is the loopback when generator is off
This is with the gen on 1KHz/1VRMS
while the generator should have this performance also confirmed by your plot with Cosmo
What am I missing?
This is the AP spectrum of the Signal Generator 1VRMS going into my EMU0204/SprecraPlus

This is roughly 10dB difference between AP and the EMU, but it's because the levels are not calibrated and shows on EMU 1VRMS sits at -10dB while on AP at 0dB?
Does it mean the software takes the whole graph 10dB lower? TDH+N is in agreement with the Soundcard measurement, AP marks 0.00083%.
Again why am I not getting matching results with the one shown on the article with all the generator measurements?
With a notch(Cosmos APU, see attached) my 2522 has H3 -136db, and H2 <-150db, however, almost any modern DACs has better THD performance.
View attachment 1349052
THD+N reaches -120db at 10V.
View attachment 1349054
I have been trying for many hours to see if I get the expected spectrum, but I am unable to get noise floor down to -160dB and highest peak at -140dB no matter what I do.
Could you be so kind to plot a loopback test of the generator at 1KHz/1VRMS on your AP? Everything being equal, I am assuming you should be able replicate the same readings you get with the Cosmo ADC which also match the ones posted on the article you linked (which doesn't specify if these spectrums are taken on the AP or on the SYS system)
Using 32k FFT the single bin resolution will be for 48kHz SR of 1.465Hz. In addition you do not know the internal calculation data mantissa, while truncation will go into account. So never ever able to compare DSP float and 64bit double or extended as on PC Intel float processing.
Newer 555B comes still with a maximum of 1M FFT. So nice PN/AM figures is still for the godfather gear a missing & required function.
So may the AP gear to use for simple wave generation and long recording of the data, if possible, then to move the wave file and process them on PC.
AP is still best as having a tracking notch done by custom IC's
Hp
looks like you still have no idea what you bought yesterday 😉 Please read ap.com appnotes, and my posts again, I said all that you need a few times(even my screenshot contains the info about how to use AP's internal analyzer to feed the "ratio" signal to FFT).I have been trying for many hours to see if I get the expected spectrum, but I am unable to get noise floor down to -160dB and highest peak at -140dB no matter what I do.
Could you be so kind to plot a loopback test of the generator at 1KHz/1VRMS on your AP? Everything being equal, I am assuming you should be able replicate the same readings you get with the Cosmo ADC which also match the ones posted on the article you linked (which doesn't specify if these spectrums are taken on the AP or on the SYS system)
Last edited:
You are correct, I don’t know it too well yet, I only played with it for a couple of days.
I looked on their website, I can only find material related to newer products, but I will continue my search.
With this being said, I have looked carefully at all the settings you show on your screenshots, I think I have mimicked them all, but I am still getting distortion harmonic well above -140db.
Since there is just a few options and they all offer the same output on the FFT, I was asking if you could duplicate the same measurement on your AP as maybe my unit has some defects.
You showed me the spectrum with the Cosmo’s setup, but do you get the same spectra when you plot FFT on your AP?
I totally understand If you don’t have the time nor the desire to take a screenshot of the FFT 1k/1V with the relative settings, and it is not a problem, I do already appreciate you have taken all this time to write all this useful material and for that, thank you.
Unfortunately it didn't let me edit the post above but I compared more documents here from AP site
Just for completeness, this is an extract from AP documentation
System 2 Cascade

2700 series

Looking closer at the bottom graph with the 22KHz filter, we can observe that 2700 has 2dB or so less noise than system two
Spectrum for the generator with notch out
System 2 Cascade

2700 Series

Here we can see the same, an improvement of 2-3dB on residual harmonics from system 2 to the 2700series.
All in all however, the two units are basically almost identical.
Nevertheless, even though my plot for THD+N vs voltage @1KHz matches the datasheet, the FFT has third harmonic significantly higher than what expected, which means I have to review my settings and study what's wrong with it.
Once I have determined the problem hopefully, I will post so if anybody runs into the same problem, at least they know how to solve it effortlessly.
Cheers.
Just for completeness, this is an extract from AP documentation
System 2 Cascade
2700 series
Looking closer at the bottom graph with the 22KHz filter, we can observe that 2700 has 2dB or so less noise than system two
Spectrum for the generator with notch out
System 2 Cascade
2700 Series
Here we can see the same, an improvement of 2-3dB on residual harmonics from system 2 to the 2700series.
All in all however, the two units are basically almost identical.
Nevertheless, even though my plot for THD+N vs voltage @1KHz matches the datasheet, the FFT has third harmonic significantly higher than what expected, which means I have to review my settings and study what's wrong with it.
Once I have determined the problem hopefully, I will post so if anybody runs into the same problem, at least they know how to solve it effortlessly.
Cheers.
Last edited:
It is 2522 AGen, 1st screenshot is 6V, second one at 10V. ADC was mine indeed but you can get the same result even with your laptop 3.5mm audio input.
The notch was EXTERNAL device, nanovolt.ch also used external notch filter.
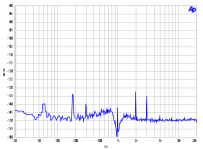
You were correct I had missed something on the Digital Analyzer. I had the input of the digital analyzer on Anlr, but for greater dynamic in the case of low distortion levels, I had to select Anl Rdg. So here it is with the option inserted:
The resulting spectrum is a match with the datasheet.
On a different note, the TDH+N on the 2522 at 1VRMS reads -113.4dB, while on the 2722 at the same level reads -116.4dB (I found a picture on internet that showed the measurement on an actual unit) thus showing an improvement over the 25XX by 3dB that is expected by looking at the two datasheets.
With this in mind, I have finished checking the analyzer and gladly, it is all within specs. Now I will go on and read as suggested, some application notes on AP's site for measurements and start putting it to use for the project I am currently working on.
Thanks to all that have helped.
- Home
- Design & Build
- Equipment & Tools
- Audio Precision SYS2522