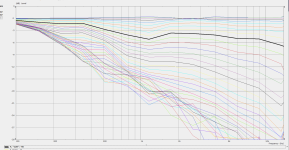
It's not a secret just a combination of parameters to get the orientation that I wanted. You can see with the spectrum hints if you have it oriented as you want. The Horizontal is set to zx plane, the verticals zy, so the up and down are set using 0 and 180 for inclination.

Just had a look at generating farfield and also at 2 meters. Subtle difference.
Horizontal "farfield"
PolarRange=0,180,37
Farfield=true
BasePlane=zx
NormalizingAngle=10

Horizontal "2m"
PolarRange=0,180,37
Distance=2m
BasePlane=zx
NormalizingAngle=10

Horizontal "farfield"
PolarRange=0,180,37
Farfield=true
BasePlane=zx
NormalizingAngle=10
Horizontal "2m"
PolarRange=0,180,37
Distance=2m
BasePlane=zx
NormalizingAngle=10
If the situation is not symmetric, like the verticals here (UP vs DOWN), you can't normalize both (separate) charts to 10 deg - that's just not physically possible. If it's symmetric, it's fine to normalize to whatever angle you want because that's what you can -in principle- get if equalized. That's not possible for verticals here so the only option to normalize would be 0 deg (on-axis).
- Or make the polar map a single chart (-180 -> 180) and then you can normalize to whatever angle you want.
- Or make the polar map a single chart (-180 -> 180) and then you can normalize to whatever angle you want.
Last edited:
A closer look at 800 to 14k horizontal normalised to 10deg. I have centered the 2dB steps to the middle of the coloured bands at 30,45,60deg.


Last edited:
What's the number of frequencies ? Looks very detailed.
Until now, I have not understood the merrit of the "Linear zero" option. Isn't it better if one can see the typical thresholds, that i. e. define pattern width at -6 dB as a color change?
Until now, I have not understood the merrit of the "Linear zero" option. Isn't it better if one can see the typical thresholds, that i. e. define pattern width at -6 dB as a color change?
100 frequencies. 200-20k log. Send me your preferred VACs style file and I’ll whip up whatever you wish.What's the number of frequencies ? Looks very detailed.
Until now, I have not understood the merrit of the "Linear zero" option. Isn't it better if one can see the typical thresholds, that i. e. define pattern width at -6 dB as a color change?
What's the number of frequencies ? Looks very detailed.
Until now, I have not understood the merrit of the "Linear zero" option. Isn't it better if one can see the typical thresholds, that i. e. define pattern width at -6 dB as a color change?
H
Distance=3m
BasePlane=zx
NormalizingAngle=0
501 Inclination=0 ID=5001
Normalised to global max amplitude - for comparision to SEOS charts?
Last edited:
V
Distance=3m
BasePlane=zy
NormalizingAngle=0
502 Inclination=180 ID=5002
Normalised to global max amplitude - for comparision to SEOS charts?

Distance=3m
BasePlane=zy
NormalizingAngle=0
502 Inclination=180 ID=5002
Normalised to global max amplitude - for comparision to SEOS charts?
Just arrived a small custom crossover board to toy with.
THAT1246 -> NE5532A -> THAT1646
ECHU or C0G caps to place. 1206 bypass caps probably should have been smaller parts.

THAT1246 -> NE5532A -> THAT1646
ECHU or C0G caps to place. 1206 bypass caps probably should have been smaller parts.
Last edited:
V
PolarRange=0,360,37
To keep the spacing the same between angular increments the last number should be 73 when you simulate 360 in one go. That way if you use the command contour from curves you can turn a polar map into a collection of polar curves evenly spaced (5 degrees separation for above), I find these to be one of the most helpful graphs.
Thanks! I'll give it a go.To keep the spacing the same between angular increments the last number should be 73 when you simulate 360 in one go. That way if you use the command contour from curves you can turn a polar map into a collection of polar curves evenly spaced (5 degrees separation for above), I find these to be one of the most helpful graphs.
Friday night rabbit hole. Good to see the test apparatus and measurements!
C. Bateman - Distortion measurements of C0G ceramic and films
https://linearaudio.nl/sites/linearaudio.net/files/Bateman EW 11 2002 mar 2003 caps 100 nF to 1uF.pdf
400V 100n TDK B32652 series - 0.00005% @ 30V DC bias
https://www.mouser.co.uk/c/passive-components/capacitors/film-capacitors/?q=B32652&voltage rating dc=400 VDC
"Distortions from these 0.1μF and 1μF Epcos Polypropylene capacitors were not bettered by any similar sized capacitor I tested.
With double the PCB footprint of the (KEMET) SMR types, however, they may not fit your available space."
Last edited:
Thinking about it some more it should be 72 as 0 and 360 are the same.Thanks! I'll give it a go.
Last edited:
Since this was introduced as you put the waveguide in the box I'd guess the waveguide profile and enclosure roundover don't mate well? Perhaps easiest test would be to increase the baffle roundovers to see if this goes away? I mean it might be hard to find optimal shape for the waveguide if it is simulated separately in infinite baffle and then put to box trying to simulate the whole system, well at least takes some time to find out 🙂 Did you try deeper box,if and how the features of the response changes?What is the cause of the 1.2k contraction?
- Home
- Loudspeakers
- Multi-Way
- ATH4 waveguide inspired multi way
