Hi John. yes, dead giveaway, you now know which amp is which. In my graphs I actually inverted the phase else it would be to easy to spot the SE amp.
Hi Sheldon, try listening to the two recording and then decide which one sounds more detailed, warmer cooler or whatever, which appeals to you. I have chosen that track for some particular reasons. Besides the particular recording was been mic'ed with dummy head in a warehouse.
My hearing is highly suspect, to say the least. It drops off like a stone at or before 10kHz, and not far down the road, I'll be looking at hearing aids. I listened to the cuts on my desktop Mac, with Shure E2c headphones and custom fitted earpieces.
FWIW, I found the first cut to sound a little more fleshed out. Another way of saying it is that the second cut sounded a tad thinner. Ironically, I'd say the first was more detailed. All this presumes that I'm not imagining things.
Sheldon
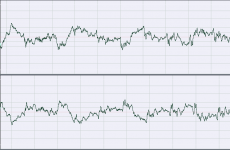
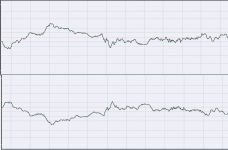
John, have a good look at the two signals and you will actually see some flaws. They were only sampled at 16 bit but even then dynamic range is still 96 dB.
The bit rate was 320kHz and resolution is good. But have a look some peaks and troughs is sharper in one sample than the other. You can increase the volume setting to get the amplitudes the same since you are working with digits it justs adds number to existing numbers, it does not change the shape.
The bit rate was 320kHz and resolution is good. But have a look some peaks and troughs is sharper in one sample than the other. You can increase the volume setting to get the amplitudes the same since you are working with digits it justs adds number to existing numbers, it does not change the shape.
Sheldon you are not imagining anything and although your ears frequency response may be a tad out of spec, you can still tell what you like and what you don't. You may not hear the character of a triangle as a young fellow would, but to you it is still a triangle, it is not a trumpet. Your mother still sounds like your mother, not like your farther.
Remember guys this sample is in the time domain and exactly as you hear it or the way it makes the speaker move. These signals are slightly different. When the amp has some dominant odd order harmonics the peaks will be rounded and even order harmonics dominating the peaks will be squared and the rise time increases, The signal as it appears and I have now proven it to myself looking intensely at the time domain plots the one will sound warmer and the other crisper.
The final verdict is not which is correct, it is which is more appealing and point to the particular topology.
I think that this thread may have been of much interest to all of us, especially me because I have never looked at it in this way and things are suddenly very clear.
John I do not know the capability of that program but can you subtract the one signal from the other and we can see the difference signal only.
It has that capacity but the samples have to be exactly synchronized. This is very difficult to do.
Another favour, Nico ole buddy 😀 - can you record a clean 1khz signal (from a function generator) with both? This would be just for testing, not for listening and could be substantially smaller than the other files.
Another favour, Nico ole buddy 😀 - can you record a clean 1khz signal (from a function generator) with both? This would be just for testing, not for listening and could be substantially smaller than the other files.
John, I do not have a signal generator at home, I will have to do it at work for you. Unless you are satisfied with one generated from the PC.
Hi Nico,
Yes, I did and I've been working to do the same here. Results:
View attachment 146742
They appear to be out of phase also. It took some time to get them synchronized.
Nico
I completely agree with John . Last night I had a quick look in Sound Forge 9 at both tracks. With the later track, both L and R have the highest +VE going peaks at 00.57.025 which seems more likely than the 1st track ,where the peaks are -VE going, and the maximum is at different times in both channels.
i.e 00.57.015 and 00.54.258.
I suspect that the 2nd amplifier is likely to be more accurate. Hey, I could be wrong too !!!
Regards
SandyK
Well its great that you agree with John, at least we have collusion that the SE amp is proffered even if it has a higher distortion. I can explain all that but I am not going to.
Interesting how long it took to realise that the SE design was an inverting amplifier.
Happy weekend all.
Nico
Interesting how long it took to realise that the SE design was an inverting amplifier.
Happy weekend all.
Nico
i.e 00.57.015 and 00.54.258.
It is impossible to record two songs from two sources starting at the exact same moment and having identical levels set, unless you have some very sophisticated equipment or software.
Took me two hours to time and amplitude align 20 mS of a complex stimulus. Never-the-less I think that it got everyone thinking about it.
Nico
Final bit of information and you can draw your conclusion.
1) The first sound clip was from HAKSA and the second from the SE amp - some said they liked the second clip more, which was the SE amp.
2) We looked at the graphical representation of the two clips and it would appear that the second which is from the SE amp could have more detail.
3) I am now providing the THD figures of HAKSA and the SE amp the SE amp has worse distortion than the HAKSA for exactly the same output. The distribution of distortion is a little different as well, but could one conclude that the slightly higher distortion is responsible for the subjective conclusion that it sounds better?
http://digisec.co.za/temp/THD%20SE.bmp
http://digisec.co.za/temp/THD%20HAKSA.bmp
Last edited:
Well its great that you agree with John, at least we have collusion that the SE amp is proffered even if it has a higher distortion. I can explain all that but I am not going to.
Interesting how long it took to realise that the SE design was an inverting amplifier.
Happy weekend all.
Nico
It shouldn't be inverting. The output to the headphones or amplifier/speakers would also be inverted - like wiring the speakers out of phase.
I will try to re-invert the file (not sure if that's possible with Audition).
If the second sample is the SE amp, there's something VERY wrong with the other one.

Last edited:
It shouldn't be inverting. The output to the headphones or amplifier/speakers would also be inverted - like wiring the speakers out of phase.
I will try to re-invert the file (not sure if that's possible with Audition).
If the second sample is the SE amp, there's something VERY wrong with the other one. :nono:
John
Once again, I agree with you.
Please email me through the system, and I will further explain with a new screengrab.I could once again be very wrong, so I would like you to check it out first.
Regards
SandyK
Ok, now I'm sort of getting somewhere. I have done some work of the files: I gave them exactly the same starting point, cut each file to exactly 1 minute long, inverted #2 and normalized the volume on #2 to match #1.
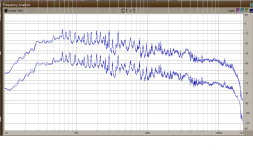
Here's what they really look like:

Sample #2 is the bottom traces. The entire sample was used for each frequency response graph.
Here's what they really look like:

Sample #2 is the bottom traces. The entire sample was used for each frequency response graph.
- Home
- More Vendors...
- AKSA
- Aspen Headphone Amp


