For Linux Users
Actually the website did plot the measured data versus the fitted equation. But in pixel size terms it makes pitifully small graphs, with no option for larger ones. I had to rescale the graph I posted before. Also, external websites can disappear at any moment, and sometimes do.
I normally use Linux, so Excel doesn't immediately appeal. But a little websearching for how to do linear regression on Linus revealed the GNU R stats package, which is quite well documented online. It's like a monster programmable statistics calculator with a command line interface. However (despite being a command line program) it can draw graphs, which open in separate graphics windows. Resizing such a window automatically rescales the graph inside it -- so it can make fully pixel precise graphs of any size that fits on the screen.
It can also graph data without doing any stats on it, making it useful for graphing the output from any instrument or simulator that outputs its data in a text file.
The attached graph was made (on my own computer) as follows. First, I made a CSV file from the data called ds101.csv. Here are its contents.
Next, the following log shows the 7 R commands I used to read the data, do the linear regression, and graph the datapoints and the regression line. R uses > for a prompt, so the commands are the text on the lines beginning with a >. The rest is output from R.
Finally, I used GIMP to capture the contents of R's graphics window and output it as a PNG file.
BTW Linux, R and GIMP are all free. MS Excel lists for $109.99.
MS Excel will perform linear regressions too.
But at least it's on your computer
Actually the website did plot the measured data versus the fitted equation. But in pixel size terms it makes pitifully small graphs, with no option for larger ones. I had to rescale the graph I posted before. Also, external websites can disappear at any moment, and sometimes do.
I normally use Linux, so Excel doesn't immediately appeal. But a little websearching for how to do linear regression on Linus revealed the GNU R stats package, which is quite well documented online. It's like a monster programmable statistics calculator with a command line interface. However (despite being a command line program) it can draw graphs, which open in separate graphics windows. Resizing such a window automatically rescales the graph inside it -- so it can make fully pixel precise graphs of any size that fits on the screen.
It can also graph data without doing any stats on it, making it useful for graphing the output from any instrument or simulator that outputs its data in a text file.
The attached graph was made (on my own computer) as follows. First, I made a CSV file from the data called ds101.csv. Here are its contents.
Code:
f,I
2557,12.02
1502,10.51
811.7,9.49
406.5,9.09
44.25,8.64
4.425,8.61
Code:
> ds101 <- read.csv( "ds101.csv" )
> rg101 <- lm(I ~ f, data = ds101)
> summary(rg101)
Call:
lm(formula = I ~ f, data = ds101)
Residuals:
1 2 3 4 5 6
0.06313 -0.03743 -0.13521 0.00613 0.04008 0.06329
Coefficients:
Estimate Std. Error t value Pr(>|t|)
(Intercept) 8.5407984 0.0490074 174.28 6.5e-09 ***
f 0.0013360 0.0000387 34.52 4.2e-06 ***
---
Signif. codes: 0 ‘***’ 0.001 ‘**’ 0.01 ‘*’ 0.05 ‘.’ 0.1 ‘ ’ 1
Residual standard error: 0.08561 on 4 degrees of freedom
Multiple R-squared: 0.9967, Adjusted R-squared: 0.9958
F-statistic: 1192 on 1 and 4 DF, p-value: 4.202e-06
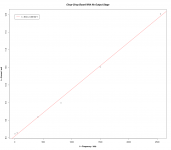
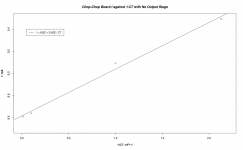
> plot(ds101, xlab = "f = Frequency / kHz", ylab = "I = Current / mA", font.lab = 4)
> title(main = "Chop-Chop Board With No Output Stage", font.main = 4)
> abline(rg101, col = "red")
> legend(0, 12, "I = 8.54 + 0.00134*f ", col = "red", lty = 1)BTW Linux, R and GIMP are all free. MS Excel lists for $109.99.
Attachments
Last edited:
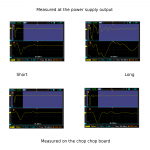
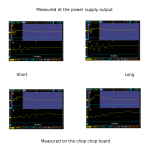
I've been practicing testing with the chop chop on a Voltec PSU at 20.7v with an 80 mA load current. To get more idea of the effect of the connection between the chop chop and the PSU I measured the PSU output voltage both right on its output terminals, and on the chop chop board itself. Then I cut off half the interconnect cable, and made the same measurements all over again. For all these measurements I used a groundspring.
The attached oscillographs show the PSU output voltage in yellow, and the chop chop trigger in blue. The 80 mA load current is drawn when the blue trace goes low, and removed when the blue trace goes high. The oscillographs are all in normal non-averaging mode, and all have the same timebase settings, with a sample rate of 500 MSa/s. But the vertical sensitivity for the yellow trace varies, it's shown in mv/division in yellow in the bottom left of each oscillograph.
2 thoughts occur.
It's still hard to discern how much of the ringing is due to the chop chop to PSU interconnect, and how much is intrinsic to the PSU.itself. The difference between the long and the short interconnects measured at the PSU when load current's applied is dramatic. Maybe all the ringing on this edge is a consequence of the interconnect? But when the load current's removed shortening the interconnect only mildly reduces the ringing. Perhaps on this edge the PSU is ringing for real?
Where is it appropriate to measure a PSU's performance? At the output of the PSU or at the load? At first I naively thought this a no brainer -- at the load, of course. After all if the voltage at the load is rock solid, does it really matter if there's a funny waveform somewhere else, even if that somewhere else happens to be the PSU's output? The chop chop oscillographs look nicer than the ones measured at the PSU. Yet it's hard to see ringing on the PSU output as OK, even if it is much less bad at the load. Especially since it's probably the cause of the less bad ringing at the load. For now I shall keep on measuring on both ends of the interconnect.
If there's 1 thing it drives home on me, it's that the interconnect between the PSU and the load matters. I'm planning on regulators and amplifier on the same PCB.
Attachments
I prefer to measure the response at the power supply output terminals. In my view, it isn't the power supply's fault that I'm attaching a foreign object, using less-than-ideal interconnects whose impedance is significant. So I measure what the the PSU feedback loop measures: the voltage at PSU output terminals.
Theory compared to the Real World
I'm back, and I've done some more measurements of the chop chop board. Enough to be able to compare my calculations from previous posts with measured results
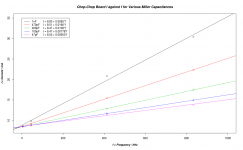
An attached GNU R plot shows measurements of the current drawn from the 5v supply for 5 different values of miller capacitor at 4 frequencies, and a least squares fit for a straight line following the variation in current with frequency for each value of miller capacitor. Another plot shows the same measurements, except that the current is plotted and regressed against the inverse of C7.
Regressing the relationship of the measured current to the inverse of C7 directly yields a formula for I in terms of C7 at each value of miller capacitor. These formulae can then be compared to the following theoretically derived formula from one of my previous posts.
The above formula is in amps and farads. Converting to mA and nF yields:
I = 0.45*(5.75 + 26*C6)/C7
Consider the coefficient of 1/C7, 0.45*(5.75 + 26*C6), in the above formula. But that formula's only for the 74AC14, the STP27N3LH5 and C6. Taking earlier measurements of the chop chop board with no output stage, and plotting and regressing the current against 1/C7 yields the following formula
I = 8.62 + 0.422/C7
So we may take the measured coefficient of 1/C7 from the regression formulae with the output stage present and subtract 0.422 from it to get the portion of the coefficient due to the 74AC14, the STP27N3LH5 and C6 (which are the output stage). This should equal 0.45*(5.75 + 26*C6) according to the theory of my previous posts. Let's see how badly my theory did:
The calculated value of the coefficient of 1/C7 is from 33% to 49% too high.
My guess is that the variation from 33% to 49% reflects tolerance in component values. I didn't measure the capacitors, I just assumed that they had the values they claimed to have. But the fact that the theoretical value is always significantly too high is obviously not due to component tolerances. I have no explanation for this at the moment, and would be interested in any ideas about why this is happening.
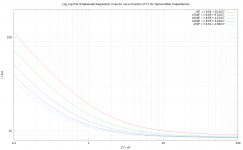
Finally, the measured results to show why a straight line on a log log plot of how the current the chop chop board draws from its 5v supply varies with changing C7 is so puzzling. The attached log log plot of the formulae obtained by regressing the measured currents against the inverse of C7 shows curves, not straight lines.
I'm back, and I've done some more measurements of the chop chop board. Enough to be able to compare my calculations from previous posts with measured results
An attached GNU R plot shows measurements of the current drawn from the 5v supply for 5 different values of miller capacitor at 4 frequencies, and a least squares fit for a straight line following the variation in current with frequency for each value of miller capacitor. Another plot shows the same measurements, except that the current is plotted and regressed against the inverse of C7.
Regressing the relationship of the measured current to the inverse of C7 directly yields a formula for I in terms of C7 at each value of miller capacitor. These formulae can then be compared to the following theoretically derived formula from one of my previous posts.
So I would expect the average current I drawn from the 7805 by the 74AC14, the STP27N3LH5 and C6 to be given by
I = 4.5E-4 * (5.75E-9 + 26 * C6) / C7
The above formula is in amps and farads. Converting to mA and nF yields:
I = 0.45*(5.75 + 26*C6)/C7
Consider the coefficient of 1/C7, 0.45*(5.75 + 26*C6), in the above formula. But that formula's only for the 74AC14, the STP27N3LH5 and C6. Taking earlier measurements of the chop chop board with no output stage, and plotting and regressing the current against 1/C7 yields the following formula
I = 8.62 + 0.422/C7
So we may take the measured coefficient of 1/C7 from the regression formulae with the output stage present and subtract 0.422 from it to get the portion of the coefficient due to the 74AC14, the STP27N3LH5 and C6 (which are the output stage). This should equal 0.45*(5.75 + 26*C6) according to the theory of my previous posts. Let's see how badly my theory did:
Code:
C6         0.45*(5.75 + 26*C6)   Meas. - 0.422   Delta   Error   Meas.
========   ===================   =============   =====   =====   =====
0.047 nF    3.14                 2.11            1.03    49 %     2.53
0.1   nF    3.76                 2.62            0.96    37 %     3.04
0.22  nF    5.16                 3.79            1.37    36 %     4.21
0.47  nF    8.09                 6.09            2       33 %     6.51
1     nF   14.3                  9.98            4.32    43 %    10.4

Delta = [ 0.45*(5.75 + 26*C6) ] - [ Meas. - 0.422 ]
Error = 100 * ( [ Delta ] / [ Meas. - 0.422 ] )My guess is that the variation from 33% to 49% reflects tolerance in component values. I didn't measure the capacitors, I just assumed that they had the values they claimed to have. But the fact that the theoretical value is always significantly too high is obviously not due to component tolerances. I have no explanation for this at the moment, and would be interested in any ideas about why this is happening.
Finally, the measured results to show why a straight line on a log log plot of how the current the chop chop board draws from its 5v supply varies with changing C7 is so puzzling. The attached log log plot of the formulae obtained by regressing the measured currents against the inverse of C7 shows curves, not straight lines.
Attachments

How about using a "gate driver" IC, TI makes a lot of them, surely you could find one fit for the purpose, and then you will not be limited to "logic level" MOSFETs (which aren't necessarily the easiest to drive from a gate current pov)?
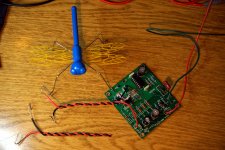
Did you wind that super-neat groundspring yourself, or is there somewhere one can buy such things?
These come standard with a lot of Tektronix probes (e.g. P6139B), I'm sure you could find some on e-bay as "used tektronix probes accessories".
The data in post #64 makes it easy to choose the value of your dropping resistor (between supply isolation diode, and voltage regulator input pin). Just use the charts to look up the worst case (largest) supply current that can flow when
- you run the oscillator at your self-permitted maximum oscillator frequency
- you install your largest self-permitted gate-to-drain capacitance
The data in post #64 makes it easy to choose the value of your dropping resistor
Indeed, R1 can now be sized.
But for some time now it's been my plan to power the chop chop board from a 5v bench supply. With my regulator under test having a nominal maximum load of 80 mA, the current to power the chop chop board can end up using up a significant portion of it's total output, significantly reducing the percentage of the total 80 mA through which the test load can swing. So, in fact, I don't need to size R1.
My real interest in this question has been the opportunity to test out my circuit theory abilities by first calculating an expression for the current, and then measuring it. At least I got within the right order of magnitude! (Though with an error of around 40%).
It's been a fun journey, but I will now return my attention to my own regulator design, about which I have a question: When an excellon file specifies the drill size for a plated through hole in a PCB, does the hole actually come out that size, or is it smaller because of the thickness of the copper plating?
- Status
- Not open for further replies.
- Home
- Amplifiers
- Power Supplies
- Another PSU Transient Load Tester ("chop chop box")