Let me try again. I had 2 copies of the file, one corrupt, probably the one i zipped because i couldn’t open it either. Here is a pdf of the other one.
dave
Dave,
That's it indeed! Thanks for finding and sharing that, I feared it was lost.
Eric
For several years I have been using LATL for modeling speakers, mainly MLTL types designs. But after reading this thread I decided to give Hornresp a try. It took a little while to get the hang of Hornresp, but now I think I have it mostly figured out. The Input Wizard and Loudspeaker Wizard really make it easy to create and modify many different alignments.
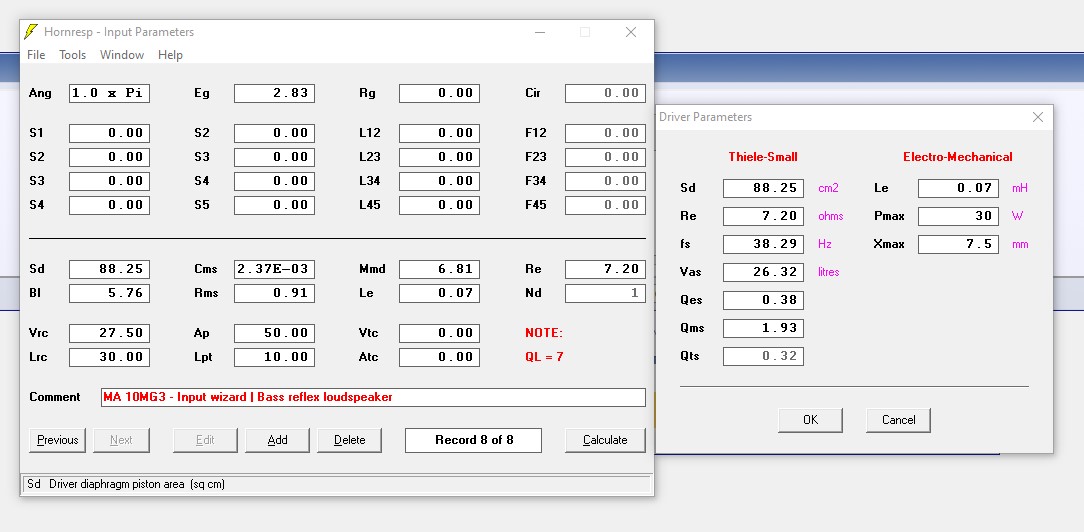
Once I had Hornresp figured out, it was natural then to compare the results from LATL and Hornresp. With both programs I modeled an identical bass reflex design using the Mark Audio Alpair 10M.3 driver, in a 27.5 liter enclosure with a port with an area of 50 cm2 and a length of 10 cm. The two results are shown below. The results are pretty similar in many respects, but one thing in particular is quite different. In the Hornresp result (left) the power falls off quickly above about 1000 Hz, while the LATL result is generally flat (excluding the spikes) out to over 10,000 Hz.
I also tried identical Sealed Box and MLTL alignments with the two programs and saw the same difference in each one. That is, Hornresp predicting a sharp fall of in response at about 1 decade lower in frequency than the LATL result.
I looked carefully to be sure my driver inputs (especially Le) were the same in both and they are. Hornresp calls for "Le" while LATL calls for "Lvc", but I'm thinking those are the same, right?
Am I doing something wrong in one of the programs? Any ideas?
Eric

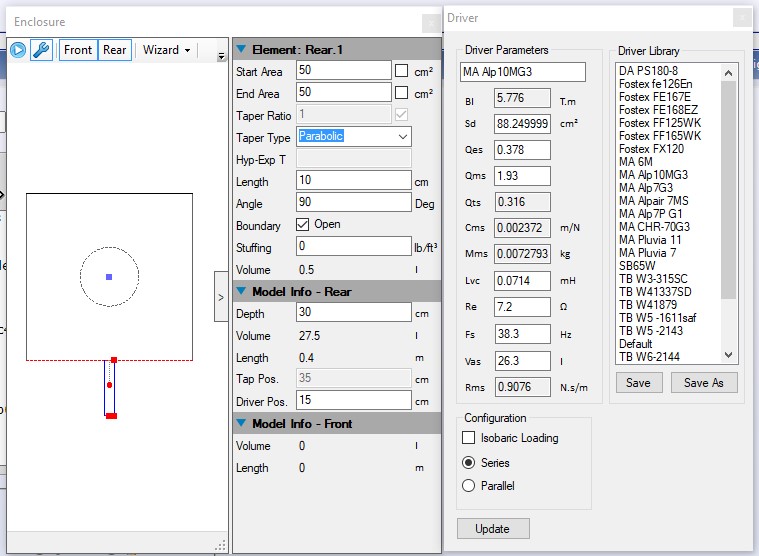
Here are my Hornresp inputs:
Here are the LATL inputs:
Once I had Hornresp figured out, it was natural then to compare the results from LATL and Hornresp. With both programs I modeled an identical bass reflex design using the Mark Audio Alpair 10M.3 driver, in a 27.5 liter enclosure with a port with an area of 50 cm2 and a length of 10 cm. The two results are shown below. The results are pretty similar in many respects, but one thing in particular is quite different. In the Hornresp result (left) the power falls off quickly above about 1000 Hz, while the LATL result is generally flat (excluding the spikes) out to over 10,000 Hz.
I also tried identical Sealed Box and MLTL alignments with the two programs and saw the same difference in each one. That is, Hornresp predicting a sharp fall of in response at about 1 decade lower in frequency than the LATL result.
I looked carefully to be sure my driver inputs (especially Le) were the same in both and they are. Hornresp calls for "Le" while LATL calls for "Lvc", but I'm thinking those are the same, right?
Am I doing something wrong in one of the programs? Any ideas?
Eric
Here are my Hornresp inputs:
Here are the LATL inputs:
bass reflex design using the Mark Audio Alpair 10M.3 driver, in a 27.5 liter enclosure
Way too big AFAIC. The biggest Mar-Ken for these is 13 litres.
above about 1000 Hz
You should not be paying any attention to anything over a few hundred Hz. You are modeling the LF performance.
dave
Way too big AFAIC. The biggest Mar-Ken for these is 13 litres.
Thanks, but it wasn't intended to be optimized in any way. Just an easy volume to create in both programs.
You should not be paying any attention to anything over a few hundred Hz. You are modeling the LF performance.
Oh, didn't realize that.
Thanks,
Eric
A few pages back, around post 144, I said I wanted to build a simple MLTL sub to replace the Pipeline TL contraption the Mrs said had to go. Over the past few weeks I have been doing the groundwork for the new one, which she won't much like either, but at least I've softened her up regarding size. It is pretty big but hey no pipes!
Gave up on the table saw for cutting straight edges and have been using that as a workbench instead. The new cordless skill-saw does a much better job, and I'm using the fence off the old table saw as a guide so with a bit of messing around I'm now able to cut out pieces that have tolerances inside of 1mm (most of the time).
So over the weekend I threw together the cutout pieces and it all came together pretty well. Currently I've just screwed it, in case the whole thing is a disaster. Will glue it once I sort out whether it's a runner or not (the alternatives are a smaller TH or BP sub). I couldn't see any any air leaks or obvious gaps during the screwing procedure.
So all that's left to do now is the end cap with the driver cutout, and wiring. Should be up and running by next weekend, hopefully.
Attachments


Last edited:
You should not be paying any attention to anything over a few hundred Hz.
Yeah, if that much; for about the 1000th time now, T/S theory is only about its acceleration BW, so peters out at each end, anything above this point is either simmed flat or rolled off based on its mass and/or if the program includes the driver's inductance [Le]:
Fhm = 2*Fs/Qts'
Flc = Fs*Qts'/2 [normally never used]
Qts' = 2*Fs/Fhm
Qts' = Qts + any added series resistance [Rs]: HiFi Loudspeaker Design
Assume 0.5 ohm for wiring.
GM
I couldn't see any any air leaks or obvious gaps during the screwing procedure.
The incredibly tiny amount or air leaking around a machine screw bolt threaded into a 't' nut can ~ null out a vented alignment, so looking forward to some measurements. 😉
GM
Hmmm. Interesting. Didn't realise it was that critical.
At least pulling apart, gluing and screwing back together is no biggie.
We can get an idea of potential with an initial listen I guess. Rigidity should be a bit better with glue too, right?
At least pulling apart, gluing and screwing back together is no biggie.
We can get an idea of potential with an initial listen I guess. Rigidity should be a bit better with glue too, right?
Way too big AFAIC. The biggest Mar-Ken for these is 13 litres.
For vented/reflex, the pioneers concluded that Vas/1.44 is the ideal acoustic loading, so at ~50.6% higher for a ~0.33 Qts' driver is a bit much as the simmed ~massive Fb peaking attests, though if 'stretched' enough to be a proper MLTL it would be a good size.
GM
Didn't realise it was that critical.
'Been there, done' that and amidst much nay-saying, others have learned the hard way too. 🙁 'Those who don't learn from history are doomed to repeat it'.
FWIW, I temporarily sealed the corners with masking tape.
While gluing will increase the joint's rigidity, it won't change the cab's if it's properly screwed together and if mitered joints are used and over cut? to ~crush the outside seams together, no glue is required if the material is moisture stable.
GM
Kiln dried to a moisture content of 8 per cent evidently. So would that be regarded as moisture stable?
Hmmm. Interesting. Didn't realise it was that critical.
Sealed is critical. You do not want any “short-circuits. If screwing a panel together you need to put a closed cel gasket around the whole thing.
It will also not be as ridgid with just screws.
dave
Hi Eric,
For your given bass reflex example, the results are different at higher frequencies because Hornresp is showing the power response whereas LATL is showing the pressure response (which means that LATL must be making some assumptions on directivity, and including them in the simulation model).
The initial peak in the response is lower in Hornresp because system losses have been taken into account (QL = 7).
For your sealed box example, try using the Directivity tool in Hornresp to calculate the on-axis pressure response, and then compare that result to LATL instead.
Kind regards,
David
In the Hornresp result the power falls off quickly above about 1000 Hz, while the LATL result is generally flat (excluding the spikes) out to over 10,000 Hz.
For your given bass reflex example, the results are different at higher frequencies because Hornresp is showing the power response whereas LATL is showing the pressure response (which means that LATL must be making some assumptions on directivity, and including them in the simulation model).
The initial peak in the response is lower in Hornresp because system losses have been taken into account (QL = 7).
I also tried identical Sealed Box and MLTL alignments with the two programs and saw the same difference in each one.
For your sealed box example, try using the Directivity tool in Hornresp to calculate the on-axis pressure response, and then compare that result to LATL instead.
Kind regards,
David
For your given bass reflex example, the results are different at higher frequencies because Hornresp is showing the power response whereas LATL is showing the pressure response (which means that LATL must be making some assumptions on directivity, and including them in the simulation model).
The initial peak in the response is lower in Hornresp because system losses have been taken into account (QL = 7).
For your sealed box example, try using the Directivity tool in Hornresp to calculate the on-axis pressure response, and then compare that result to LATL instead.
David,
Thanks, I was hoping you would reply.
I didn't realize that the response variable was different (i.e. pressure vs. power) so that's good to know.
I did try the Directivity tool also and yes, the results look mor similar when I set the angle to zero. So many new tools to play with!
So below is my (unstuffed) MLTL example. Here the striking thing is the difference in the "spikiness" between the two models, and in particular the big drop in output predicted by LATL for the region between the 1st and 2nd overtones (i.e. between about 180 and 280 Hz). Hornresp predicts overtones in the same locations, but virtually no dip below "baseline" power.
Is this difference also just due to the fact that LATL result is pressure, and Hornresp is power, or is there more to it than that?
Eric

Is this difference also just due to the fact that LATL result is pressure, and Hornresp is power, or is there more to it than that?
Hi Eric,
Power and pressure response results are normally reasonably close at the lower frequencies, where "beaming" due to directivity is not a significant factor. The difference you are seeing below about 300 Hz is probably due to the Hornresp simulation having a specified acoustic path length of 100 cm. (It is difficult to know for sure without seeing the inputs you are using, but I suspect that LATL assumes a zero path length). Do the results look more similar perhaps, if the Hornresp path length is set to 0 cm?
Kind regards,
David
Attachments

'Been there, done' that and amidst much nay-saying, others have learned the hard way too. 🙁 'Those who don't learn from history are doomed to repeat it'.
Ain't that the truth! You first told me about this about 15 years back as a useful way of bleeding off some unwanted pressure / output, and even now, it never stops surprising me how much of an impact it can have.
Hi Eric,
Power and pressure response results are normally reasonably close at the lower frequencies, where "beaming" due to directivity is not a significant factor. The difference you are seeing below about 300 Hz is probably due to the Hornresp simulation having a specified acoustic path length of 100 cm. (It is difficult to know for sure without seeing the inputs you are using, but I suspect that LATL assumes a zero path length). Do the results look more similar perhaps, if the Hornresp path length is set to 0 cm?
Kind regards,
David
David,
Thanks for your reply. Does path length simply mean the distance between the driver and the port? The inputs I used and the schematics for both models are shown below. Unfortunately not every input for the LATL model appears in the image, but in both cases I modeled a 120 cm line with the drive and port each 10 cm from opposite ends.
If I'm understanding he meaning of "path length" correctly, setting the path length to zero would mean placing the port and driver at the same location in the line, is that correct? Doing that in Hornresp did not make the results more similar. Is that what you meant or am I misunderstanding?
I don't think LATL assumes a zero path length, because moving the driver and/or port to different locations definitely changes the results, and in particular the locations of the peaks and valleys in the SPL plot.
Thanks
Eric

Hmm, looks like one of my HR sims done by setting the path length 1/2 the distance between the driver/port to emulate ~what we hear at a seated distance, so setting to zero should put the peaks/dips ~at the same frequencies, though from very dim memory the LA's TH sims were inverted, so at this point trust HR over LA is what I'd do.
GM
GM
Hmm, looks like one of my HR sims done by setting the path length 1/2 the distance between the driver/port to emulate ~what we hear at a seated distance, so setting to zero should put the peaks/dips ~at the same frequencies, though from very dim memory the LA's TH sims were inverted, so at this point trust HR over LA is what I'd do.
GM
Maybe I don't know what "path length" is. LA never refers to it. HR calculates it automatically, or defaults to something. I don't know how to change it. In HR, path length appears to be the distance between the driver and the port. Or maybe that's just a default?
What are "TH" sims? Transmission Horns??
Eric
Historically, software assumes the driver/vent are concentric, ditto HR, so where there's a defined location for each, the program calculates the delay between them.
HR does allow us the option to offset the delay, which is what I/whoever did in the sim. I used LA some, but don't recall having the option, so concentric TTBOMK.
TH = tapped horn, i.e. a bass pipe [TL] horn that folds back onto itself to sum the loads of both sides of the driver; technically a 6th order band-pass [BP6] alignment.
GM
- Home
- Loudspeakers
- Full Range
- An Improved Transmission Line Alignment