What if you had a mic in front of a full range driver and one very near a side panel and you recorded ( playing music ) them both as stereo - then you played the driver recording ( in both ears with decent headphones ) then the side panel recording, then summed together.
Yes, the idea would be to separate on signal from the other no matter how you do it.
Probably the best thing would be a "balloon" measurement that could be seen in software like Ease. That's common in the pro audio world. You get a measurement of the sound-field all around the speaker that can then be visualized and also used in system/room simulation. You wouldn't exactly know what was what with one balloon measurement, you'd have to make changes to the cabinet and measure again.
As informative as that would be, it would be equally as expensive and time consuming.
An externally hosted image should be here but it was not working when we last tested it.
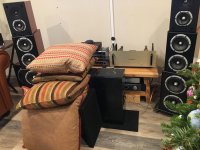
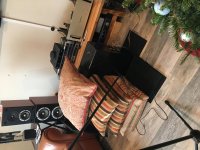
Okay, so that was easy. I placed the Dunlavy’s together, hooked one up out of phase, played some correlated pink noise, and wow! It’s so loud! I put my ear up to where the speakers meet, and there’s very little noise. It’s all coming from the panels. As you can see, I covered one up with thick pillows to hopefully keep the lower panel frequencies from canceling out the other side. My wife is using the kitchen(bull in a China shop) so no useful measurements today, but it should be a piece of cake when I eventually run some sweeps.
Attachments
Last edited:
Have you tried just listening to music, it would be interesting to know your impressions now, after you've got used to the sound of your other speakers.
I blew the tweeters on the Dunlavy's a long time ago and Vifa no longer makes that tweeter model, but in their current condition, they're perfect for this experiment
I guess Peerless makes that tweeter now, so I can fix the Dunlavy's. DAL did modifications to the originals, so it won't be perfect. Better than nothing. At least they're relatively inexpensive.
Peerless by Tymphany D27TG35-06 1" Silk Dome Tweeter
Peerless by Tymphany D27TG35-06 1" Silk Dome Tweeter
Okay, finally a few measurements..
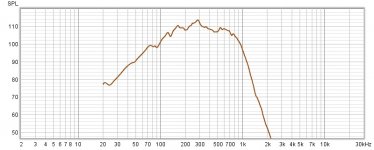
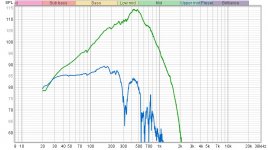
The first image is on axis at 10 cm
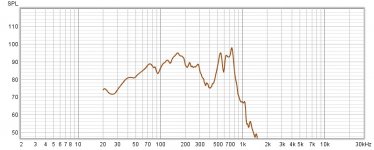
The second image is the side panel at 10cm
The relative amplitude is much closer than I could have imagined. Yikes!
Compare to John Atkinson's accelerometer measurements..
https://www.stereophile.com/images/archivesart/1294SCIfig12.jpg
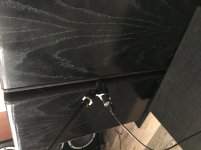
The lower side panel frequencies are very surprising. These speakers are stuffed all the way with acoustic foam, but I'll try to see if they have any bracing at all.
The first image is on axis at 10 cm
The second image is the side panel at 10cm
The relative amplitude is much closer than I could have imagined. Yikes!
Compare to John Atkinson's accelerometer measurements..
https://www.stereophile.com/images/archivesart/1294SCIfig12.jpg
The lower side panel frequencies are very surprising. These speakers are stuffed all the way with acoustic foam, but I'll try to see if they have any bracing at all.
Attachments
Last edited:
Thanks for the measurements and the photos. I just worry that much of that is still the drivers. But how to know? That's the question.
The side panel resonance measurements by John Atkinson line up perfectly with my acoustic measurements in the 500 to 750hz range, so the comparison there can be confirmed as pretty much valid. In that area, it's only about 10db down from the reference.
Last edited:
I'm confused. Those are mic plots? Uncalibrted (unless the vibration really was 110dB)? Uncalibrated wouldn't matter if you plotted the sound from the driver on the same chart - which gives S/N. Which is a good start on assessing audibility.
B.
B.
Yes, the mic is calibrated(Umik-1), but this is a relative comparison at 10cm. I wanted the signal to noise ratio to be as high as possible without clipping the mic. The vibration peak is only at 98db. The loudspeaker on axis is 108db.
Last edited:
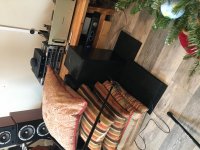
Dunlavy midbass, in phase and out of phase. Taken at exact center, between speakers..
Attachments
Last edited:

Yes, the mic is calibrated(Umik-1), but this is a relative comparison at 10cm. I wanted the signal to noise ratio to be as high as possible without clipping the mic. The vibration peak is only at 98db. The loudspeaker on axis is 108db.
No disrespect but have you calibrated the "absolute" loudness of the measurement system (typically using an SPL meter - even a smart-phone app) or only the FR of the mic? As I said, not critical but helpful to see the levels your mic is picking up.
The S/N I meant was speaker/cab ratio. What is that?
B.
The Umik-1 usb mic is automatically calibrated for spl readings when used with REW, so FR readings are also of the correct absolute spl. I will also do the measurement again, putting them both on the same graph. Hopefully that answered your question🙂
And of course the calibration file is loaded.
Acoustic Measurement Tools : UMIK-1
And of course the calibration file is loaded.
Acoustic Measurement Tools : UMIK-1
Last edited:
what I was expecting is that the best cancellation (between the two out-of-phase drivers) would be at low frequency, and the cancellation would become less effective at higher frequencies.
You are getting about 10 dB of cancellation at 100 Hz, and closer to 20 dB at 200 Hz. By 400 - 700 Hz you are getting 30 to 40 dB of cancellation.
You are getting about 10 dB of cancellation at 100 Hz, and closer to 20 dB at 200 Hz. By 400 - 700 Hz you are getting 30 to 40 dB of cancellation.
- Home
- Loudspeakers
- Multi-Way
- Accelerometers to measure panel vibrations?