EricEucy,
What is the "3d" you are talking about? I don't know if it works for me because I don't know what it is!
Actually- It is now sort of working - just a little sensitive/flaky - Do the standard run - then move your cursor up to the title of each graph and you should see micro-menus on each including the 3d button - the trick is that after selecting a button, you must move the cursor off the graph before the selection 'engages' - same for reverting except for the home buttons which works immediately.
The interrogation bit - you must deselect all the micro menu buttons to get back to the cursor arrow otherwise the interrogation doesn't work.
It's a great achievement by Dave and his team, and is fun to try but in the current form is of limited practical use in real terms - IMO at the very least we do need to get more control over the support feature - almost like the 'paint' process used by Orca Slicer with selectable extent and properties.
The Q stuff - yep, we need to do some heavy lifting on that
Hope this helps
Cheers
Eucy
Further to the above - when interrogating the graphs, there is a 'wandering' circle following the cursor around at a distance which doesn't appear to do anything. To interrogate, you have to pause the cursor arrow for a second or two before the correct circle appears at the cursor position and the data box opens on a left click.
Eucy
Eucy
Hello Eric,The reason this seems unlikely to me is because exciters bounce like that is only when they are driven at very low frequencies, close to their "magnet" fs.
I have not a great interest in driving one panel with several panel but the situation Steve shown seems to me more complex.
The situation is that 2 exciters separated by about 50mm feed by the same music don't behave the same. One magnet bounces a lot, the other not like if there is somewhere a strong asymmetry. One key point is the 2 exciters are wired in series so the impedance of each (linked to its location on the panel) modify the behavior of the second. so they are not exactly driven by the voltage source which is the amplifier but the amplifier through the impedance of the other impedance. In standard loudspeaker it is well known that an increase of the source impedance (ie a too small output capacitor, if ther is one, or a too high output impedance reduce the loudspeaker damping). I already proposed this additional way of coupling between exciters. Seeing again the video, it is I think something to take into account in this problem.
Christian
two exciters mounted at the same point on the diaphragm but on opposite sides wired so they push together and pull apart at the same time should all but offset the magnet bounce.
I don't think... in the video, the panel is playing.two exciters mounted at the same point on the diaphragm but on opposite sides wired
For those of you that have not tried Dave's (@EarthTonesElectronics) PETTaLS simultion software, you really should give it a try! As I mentioned in a recent post, I really enjoy the "real time" surface velocity map feature. It's very informative and also fun to watch. See the video below of a simulation I just ran. This simulation runs from 20 Hz to 5000 Hz. It takes about 10 or 15 seconds before anything obvious happens, so don't be too impatient.
To me it looks look new antinodes are "born" at (or adjacent to) the exciter, then move away as they "mature", making room for a new antinode to be born. I love it.
Eric
To me it looks look new antinodes are "born" at (or adjacent to) the exciter, then move away as they "mature", making room for a new antinode to be born. I love it.
Eric
Hi all -
Too many comments to respond to directly - I just uploaded some new versions of the software (again) - you should be able to re-download and re-install easily if you've done so before...
Anyway, here are some changes:
Too many comments to respond to directly - I just uploaded some new versions of the software (again) - you should be able to re-download and re-install easily if you've done so before...
Anyway, here are some changes:
- I moved the run/stop buttons to be closer to the panel surface diagram.
- I added some new code to differentiate point forces (current driven) and actual exciters (voltage driven) as Christian suggested. The differences aren't really apparent unless you drive something really light with a really powerful exciter, though.
- The frequency now actually only simulates up to the cutoff - before, it would always simulate up to 20kHz but just stop adding modes over the cutoff, which was pretty confusing.
- The IR follows the selection of frequency response angle instead of always being the on-axis IR.
- I stopped making the cutoff reset to 2kHz - the STOP button took care of that problem.
Hello Eric,I really enjoy the "real time" surface velocity map feature. It's very informative and also fun to watch.
I completely share your opinion. It is nice you made a video to share it (I am thinking which software do that under Linux ;-) )
It is interesting to see how the area of "high displacement (or velocity" move over the panel up to a certain frequency where it is concentrated around the exciter (PIP?)
To make a link with the directivity plot, in the lowest frequencies, the first mode works from an almost central position, then there is a range where the high velocity moves over the panel which is I guess an excellent think to avoid what happens with a standard open baffle and then the emission is concentrated around the exciter which, as for the first mode, might be the signature of a dipole.
By the way
- have you played with the exciter position? The FR seems highly sensitive to it. The range 0.35 / 0.40 might be a good range. In come also to the opinion that some off axis position is needed for the dipole aspect (combination of the front and the rear waves in the air). This is not shown in Dave's tool (the FR is from a baffled DML) but I have some indications in the directivity plots of edge emission (diffraction?) from panels with an exciter on the vertical axis (test of the 35%, 50% placement suggested in B Zenker's video) that might be smoothed by an of axis exciter (tests to be done)
- have you had a look the the FFFF case? Interesting (should I say intriguing?)... even if the placement of fixation points might be a challenge.
PS: @EarthTonesElectronics , David, thanks again for sharing this tool (for Windows AND Linux!) that should help us to progress faster.
As you can tell, I've been playing around with Dave's PETTaLS simulation software. I decided to do a few "reality" checks, just to make sure the model is behaving as it should. I'm sure Dave has done a ton of checks himself, but I wanted to see for myself.
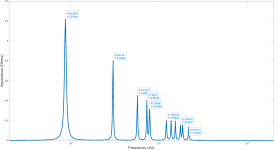
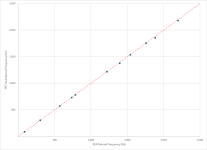
My first check was comparing the natural frequencies predicted by Finite Element Analysis (FEA) with those in the simulation. I used the following parameters, but modified the Quality Factor to 25 in order to sharpen the peaks and better define the natural frequencies in the impedance plot.
Material: Acrylic
Lx: 0.3 m
Ly: 0.2 m
Point force at center (0.5, 0.5)
Limit: 2000 Hz
Boundary Conditions: SSSS
The first plot below is the Pettals impedance plot, with the peaks identified. The second plot compares the natural frequencies calculated by the FEA with the peaks in the Pettals impedance plot. As expected, the two are in virtually perfect agreement.
Eric


At times I have been also thought that when the velocity becomes concentrated at the exciter, that that was the frequency above which PIP really started to dominate. But that is not correct. See Dave's response here to my earlier post.It is interesting to see how the area of "high displacement (or velocity" move over the panel up to a certain frequency where it is concentrated around the exciter (PIP?)
As second possibility, however, could arise from the fact that (even without high damping), at high frequencies multiple modes are excited. And all those excited modes have antinodes at or near the exciter location. So near the exciter, all those modes will be in phase with the exciter's motion, and have relatively large velocity there. But once you get far enough away from the exciter, it seems likely that the velocity will tend toward zero, simply because some of the excited modes will be "in-phase" with the exciter, and other will be "out-of-phase" at any particular location far...
What we are calling "PIP" is what Dave is calling evanescent waves. And his model does not include those in the simulation. The apparent "concentration" at higher frequencies arises from the simple fact that at high frequencies many modes are excited simultaneously, but ALL of those modes have antinodes at the exciter. While at any other random location at any distance from the exciter, you are as likely to be at an antinode as you are to be at a node. So at every other location the velocity is going to be much lower than at the exciter.
So there may indeed be "PIP" there (or not), but regardless it is not in the simulation. That's what I understand, anyway.
Eric
Well, sorta - evanescent waves are part of the solution to the plate differential equation when solved in the time domain (rather than the modal domain), and they are considered non-propagating waves on the surface. Their amplitude under most forcing functions, though, is vanishingly small, and they're almost always ignored in any simulation (like mine). Those waves technically exist at even very low frequencies. The "PIP" effect is more like propagating waves, but a at place where there's a very high density of modes. If you can see multiple wave peaks in the pattern, then it's a propagating wave and not an evanescent wave.What we are calling "PIP" is what Dave is calling evanescent waves. And his model does not include those in the simulation.
Phew!The first plot below is the Pettals impedance plot, with the peaks identified. The second plot compares the natural frequencies calculated by the FEA with the peaks in the Pettals impedance plot. As expected, the two are in virtually perfect agreement.
No problem!Too many comments to respond to directly
I just downloaded the latest Linux installer. It works fine. The tool was updated with no problem. I have now a small bash script to launch PETTaLS bash with the Matlab path and before the export command you suggested.- I just uploaded some new versions of the software (again) - you should be able to re-download and re-install easily if you've done so before...
To make an app launcher for Gnome or Xfce4 desktop should be quite easy. If some are interested, I can keep inform on that.
That good to have the frequency closer to the velocity plot. In addition it will be visible from snapshot or video (like Eric's one). Cool.
Below are 3 quick simulation with the 3 different sources provided. There is now a difference between the point force (current driven panel) in pink and the exciters (voltage driven exciters) in blue and red-brown.
Christian
Yes, some. My simulation video was at 0.45/0.45 exciter location. But not for any particular reason other than that I thought it looked cooler than other locations. I think the best position will always vary with the design and goals. At lower quality factor (high damping) the response gets less sensitive to it, as far as I have seen, for example.have you played with the exciter position? The FR seems highly sensitive to it. The range 0.35 / 0.40 might be a good range.
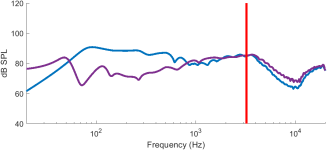
Yes, some. The tests I was doing just yesterday confirmed lower SPL at low frequencies with FFFF, compared to SSSS. See for example the comparison below with SSSS in blue and FFFF in purple. The SSSS has more output from 60 Hz to 1000 Hz, and by 20 dB in places. These simulations (and the ones below) were limited to 5000 Hz. Note that none are "optimized" in any way.have you had a look the the FFFF case? Interesting (should I say intriguing?)... even if the placement of fixation points might be a challenge.

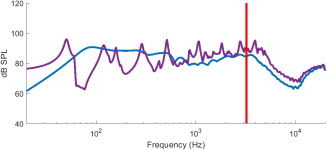
For me the other big challenge with the FFFF panel is that it is more difficult to add sufficient damping. So I think an even more realistic comparison is like the one below, where the quality factor is much higher (lower damping) for the FFFF case (purple) than for the SSSS (blue) case, This is because while you can easily incorporate damping into (roughly) simple supports by using the right kind of foams, you can't add much damping to a panel with free edges with the same ease. Hence the FFFF panel is more likely to have spikes in the response like the purple response (and ring) unless you can find an appropriate coating that isn't so heavy that it kills your efficiency. I'm not saying you can't make a good DML with a free panel. If you can this model may help you design it. That's the beauty of this simulation tool!

Eric
Hello Eric,At times I have been also thought that when the velocity becomes concentrated at the exciter, that that was the frequency above which PIP really started to dominate. But that is not correct. See Dave's response here to my earlier post.
At the moment, I am not convince... I have to think about it. The modes are for me a kind of intellectual trick handy to describe the reality and make easier calculations. In practice, there are 2 ways to observe a system. Over the time with an impulse input (hammer, stone, Dirac...), the second in frequency with a sinus as input. The time view is more recent has the calculation are not simple, the frequency view older.
Anyway, as you suggested I do as animation, if you input a sinus in a panel, all the modes that can have a contribution at that frequency will have a part in the result, what ever the result is, reinforcement or cancellation. It is only the modal model in our brain which is able to split this reality in the different contribution.
It is like a synthesis of for example an square wave or a Dirac with a sum of sinus. We know mathematically it is s sum. In reality, at the scope it is a square wave or a pulse.
Our panels are rather low Q devices which means the contribution of a mode is not that limited in the frequency range. It is even a target in addition to have a certain mode overlap (I still wonder where is the optimum...).
Probably to be continued...
Christian
The simulations I made shown the opposite... Smoother FR for the FFFF... Strange. We should share the characteristics and dimensions of the panels.Yes, some. The tests I was doing just yesterday confirmed lower SPL at low frequencies with FFFF, compared to SSSS. See for example the comparison below
In the second plot, are the 2 simulations with the same Q? The one of the FFFF seems high?
The good point is we are going to the possibility to make design choices with figures!
Christian
Good thing you did it but it is not the most relevant use case... The tool is based on the mode shape calculation. If I remember FFFF is the only (only?) with an exact solution. But you are right, better to check as we did long time ago with Paul for different other simulations (including my FDM approach).My first check was comparing the natural frequencies predicted by Finite Element Analysis (FEA) with those in the simulation.
The check of the impedance curve will be more informative, about the simulator but also as element of the process to adjust the material parameters (see Eucy's post about the Q value).
Christian
Christian,In the second plot, are the 2 simulations with the same Q? The one of the FFFF seems high?
No they are not. And that was on purpose. My point was that with a foam perimeter, which acts much like an SSSS boundary, you can add damping and hence easily achieve a substantially lower Q without otherwise changing the plate properties. But with an FFFF plate, you have no opportunity to add damping in such a simple and effective manner. So if you use the same exact panel in two DMLs, where one is SSSS (attached to a frame with a high damping foam around the perimeter), and the other is using the same panel but FFFF, the latter case will effectively have much higher Q, despite being the same panel. That is the comparison I was making in the second example.
Of course it's possible to add damping to an FFFF panel with coatings or the incorporation of constrained damping layers. But how much damping can you really add? And by doing so, how much weight do you add to the panel and how badly do you therefore compromise its efficiency/sensitivity. I think that is one difficulty with the FFFF configuration.
Eric
Christian,If I remember FFFF is the only (only?) with an exact solution.
Yes, only one as far as I recall, but it's the SSSS case.
Eric
I did see that in some cases too, if using the same Q. But as I noted above, I'm not sure that is realistic.The simulations I made shown the opposite... Smoother FR for the FFFF... Strange
Eric
I've noticed in my empirical tests that FFFF mode Qs are around 2x what they are in the SSSS or CCCC cases. This effect definitely comes from edge damping, which I plan to eventually add to the model but don't have in there just yet. So for the time being it's probably best to assume something like Q_FFFF = 2*Q_SSSS. But I think this is something that is still open to experimentation!I did see that in some cases too, if using the same Q. But as I noted above, I'm not sure that is realistic.
The low FFFF modes also have lower Qs because they're really high velocity and really low frequency (even relative to the SSSS/CCCC case), so they get damped pretty effectively by the acoustic loading and by the back EMF on the exciter.
- Home
- Loudspeakers
- Full Range
- A Study of DMLs as a Full Range Speaker