Leob,@Veleric I would be very curious to see the same simulation but suspended on the middle of each side to see how it compares. If you have to possibility I would be super grateful!
It's very simple to do the simulation and I'm happy to do it. The only part that's a PITA is that I have no way to display more than one mode shape at a time.
I'm assuming you mean still four points or contact (8 if you consider face and back), and not the centers in addition to the original suspension points, correct?
Eric
Thanks Eric, great posts!
That does clarify several things I was unsure about, and that I cannot come close to comprehending the physics behind, but correlates well with some of my observations. Both that the modes can shift in frequency and not only amplitude, and that affecting magnitude of a mode affects a broader part of the spectrum than the frequency of the mode.
That does clarify several things I was unsure about, and that I cannot come close to comprehending the physics behind, but correlates well with some of my observations. Both that the modes can shift in frequency and not only amplitude, and that affecting magnitude of a mode affects a broader part of the spectrum than the frequency of the mode.
Precisely, only on the centers.I'm assuming you mean still four points or contact (8 if you consider face and back), and not the centers in addition to the original suspension points, correct?
Leob,
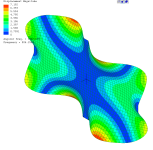
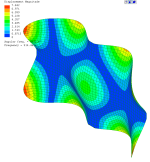
Revised results below. Note, I left the panel properties the same (despite the wrong density) so the only difference would be the suspension points.
I stopped copying modes shapes at 10 this time....
Also, a few other notes: I would normally not give too much credence to one of my models without first making a measurement of the panel's elastic moduli and density, and then also verifying with "tap testing" that the natural frequencies are actually at the expected frequencies, and are only excited by tapping at the predicted antinodes, and not excited when tapping at predicted nodes. Then at least I know that I haven't made any big mistakes in modelling. Since we have not done any of that here, it is very speculative at best. Still fun though!
That said, only modes 4,5 and 10 would likely be excited by generally central exciters. But these would also be the ones that I would expect to radiate well anyway, so maybe not so bad in that respect.
These plots also show what look like sharp bends at the suspension point edges. I wouldn't worry about that, I think it's mainly due to the nature of the graphics.
Eric
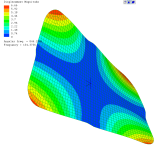
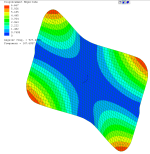
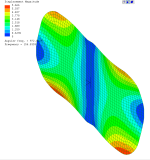
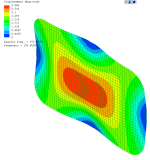
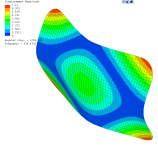
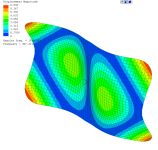
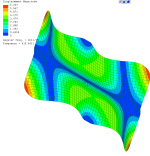
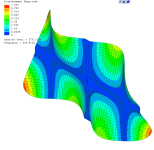


Very nice , thank you Eric!
Surprising that the first mode is now at 134Hz instead of 96. Can really the suspension points shift it that much?
Also curious that there now is 5 modes in the sub 200Hz range instead of 3, even if the range is smaller.
Regarding the sharp bends, it seems to have some relevance in showing how hard the suspension have to constrict the plate at different modes. I don't think that it is a coincidence that the region around 800Hz both looks stressed in FR and THD graphs as well as in your simulation. I would be very curious to see how modes 14 and 15 looks with centred suspension.
I get the impression that with the suspension points in the center it is allowing the plate to move quite freely in most modes. If nothing else due to the fact that the early modes looks more "wavy" than with suspension on the sides where there are many large blue areas with only movement in smaller areas. However perhaps putting the suspension along the sides offers better ability to specifically target modes that should be tamed, but requires making sure you get the exact right positions, and is easier to get really wrong.
Hope to be able to do some test soon, but might not be until next weekend. Both testing FR when using centrally placed suspension, and also trying to move the suspension on the sides a cm or so at the time and see how response changes.
I get what you are saying but I don't think that's a good way of thinking about it. The issue is that as soon as you add a fixed suspension point or points, you can pretty much throw out the modal response of the original free panel. It becomes completely different. You don't just change a single mode, but rather you change substantially the shape and frequency of every mode that doesn't already have a node at the point you have fixed. This is in contrast to the addition of an exciter, which has a comparatively minor effect on the modal response.When looking at the chalmers diagrams, for suspension of the the plate, what do you think would give the best results? My thought is that you want to place them on a prominent line to dampen the strongest modes to even out the response
Also, it's a pet peeve, perhaps, but I don't think it's correct to call this type of manipulation "damping". For me, damping is reserved for the use of an energy absorbing feature, like a visco-elastic support, or layer within the panel. A rigid or elastic support doesn't do that, so it isn't really damping to simply re-arrange the supports or exciters. It surely has an effect, but imo it's wrong to call it damping.
That said, I'm sure you can sometimes reduce or eliminate peaks in the frequency response by moving the exciter farther from the antinode of that mode and closer to a node for that mode. Not so hard to try, if you have a good idea of what the mode shapes are for each natural frequency. That's where a good model can come in. Otherwise you are just fishing around blindly...
Eric
No surprise. Moving the suspension points changes the mode shapes and frequencies completely.Surprising that the first mode is now at 134Hz instead of 96. Can really the suspension points shift it that much?
Also curious that there now is 5 modes in the sub 200Hz range instead of 3, even if the range is smaller.
Eric
EricI placed the single exciter halfway up the 14" dimension and at various locations along the 48" dimension. At each position, several of the (1,n) modes were excited, and hence exhibit peaks in the impedance curve. And by overlaying all the individual impedance curves, the natural frequencies of the 1,1 to 1,9 modes are easily inferred (as labelled on the curves). For reference, the 1,3 mode is shown here.

I note that although the exciter was located at mid width of the panel, the antinodes are not centrally located but alternate either side of the mounting point Centerline... What do you think caused this.?
Also, thinking of patterns brought to mind perhaps my earliest chladni test on a 1200x400 Cedar panel which was just resting on soft side edge supports. (Exciter being moved around manually, but off centre). I was aiming for an f0 of 25 Hz, which I managed, but interestingly, along with the large central football shaped zone (anisotropy effect), a second zone started to be formed at the end of the panel furthest from the exciter, cut off by the panel edge. So if panel is of infinite length, mode 1,1 would logically repeat with declining amplitude each way moving away from the exciter position. So 1,1 is only 1,1 when the ends are supported/restrained.
Eucy
Eucy, I'm not following. Are you talking about the odd, odd modes in particular? All of those have a red circle (antinode) in the dead enter of the panel. I'm not sure what you mean by mounting point centerline? Is it the horizontal centerline (48 inches long) or vertical centerline (18 inches long) that you are referring to? Weird how seemingly simple descriptions are not as simple as they seem. I'd like to try and answer, but don't know exactly what you mean and fear confusing things more if I try!I note that although the exciter was located at mid width of the panel, the antinodes are not centrally located but alternate either side of the mounting point Centerline... What do you think caused this.?
Eric
Eucy,Also, thinking of patterns brought to mind perhaps my earliest chladni test on a 1200x400 Cedar panel which was just resting on soft side edge supports. (Exciter being moved around manually, but off centre). I was aiming for an f0 of 25 Hz, which I managed, but interestingly, along with the large central football shaped zone (anisotropy effect), a second zone started to be formed at the end of the panel furthest from the exciter, cut off by the panel edge.
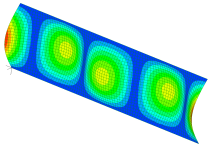
Was it a little like this perhaps? This is the second mode of a panel fixed along the long edges and free along the short edges.

Concerning the infinitely long version of this idea, I think you only get modes (kind of) like these:
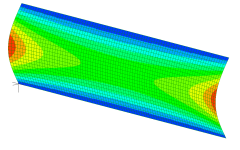
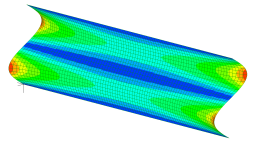
except it would not have the maxima at the left and right edges because it would be infinite so there would be no edges.
But I don't think the infinite version would have any like the one below. For one, if it's infinite in length, at any given "y" value, every position along the "x" direction length is identical and has to have the same displacement. Another explanation is that since it's infinite in length there is no left or right edge, hence no reflection, hence no interference to create nodes and antinodes along the x direction. Does that sound right to you?
Eric
Eric.. In your plot of the 1,3 mode in the post where you placed the exciter at mid width , the antinode peaks zigzag either side of the centerline instead of being centrally located... That's what I'm asking aboutEucy, I'm not following. Are you talking about the odd, odd modes in particular? All of those have a red circle (antinode) in the dead enter of the panel. I'm not sure what you mean by mounting point centerline? Is it the horizontal centerline (48 inches long) or vertical centerline (18 inches long) that you are referring to? Weird how seemingly simple descriptions are not as simple as they seem. I'd like to try and answer, but don't know exactly what you mean and fear confusing things more if I try!
Eric
Cheers
Eucy
Eric.. It was, but it occurred at 25hz on a panel for which the calculated f0 was 25 hz, so I didn't test any lower. At the time I assumed it was f0 and the repetition was just the free edge effect.Eucy,
Was it a little like this perhaps? This is the second mode of a panel fixed along the long edges and free along the short edges.
Interesting..
Eucy
Eucy,Eric.. In your plot of the 1,3 mode in the post where you placed the exciter at mid width , the antinode peaks zigzag either side of the centerline instead of being centrally located... That's what I'm asking about
Cheers
Eucy
I think I understand know. I suspect what you are seeing is an illusion due to the way I chose to display the mode shapes.
LISA has several ways to display the mode shapes. The most simple is the straight on "XY" view, which looks like this:

or the isometric view:
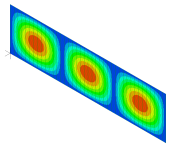
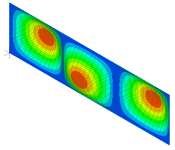
or the isometric view with deformation (below). I think this "deformed view is what's deceiving you. It's supposed to be showing that the two end antinodes are in phase with each other and out of phase with the central antinode. But I can see how it also might appear that the antinodes zigzag.
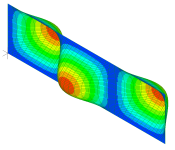
If I exaggerate the deformation, it looks like this. Maybe that makes it clearer?
Eric
Eucy,
Oh, I misspoke. The mode above is actually the third mode, not the second.
First two would be these:


But either of these would have been difficult to find in your Chladni test. For one, the frequencies of all three are very close. But also, the first one would just send all the "sand" to (and probably off) the edges, so wouldn't make much of a pattern. And the second would not have even been excited, assuming your driver was at or near the center.
Eric
Eucy,
Oh black tea! Nothing I ever tried worked very well. Maybe I'll try that.
Oh black tea! Nothing I ever tried worked very well. Maybe I'll try that.
Please do Eric... It'll be interesting to see how it fits with your theoretical results.
The tea gets a bit lively but it works quite well I found
It would also be good if Leob could try it on one of his panels to see the results of the multi exciter grouping
Cheers
Eucy
The tea gets a bit lively but it works quite well I found
It would also be good if Leob could try it on one of his panels to see the results of the multi exciter grouping
Cheers
Eucy
Would love to take time to do more testing, but also on a schedule to get 16 plates done for the summer :\
And for exciter placement I decided that will not change for this iteration at least. I'm quite confident that central cluster is the best option if you want high power density. With many things like plate dimensions, suspension, etc. what is the optional configuration is obviously very material dependent, but I don't think that is really the case with central cluster vs other exciter configurations. So for that I think I can trust Tectonic made a smarter choice that I can do, at least unless I really get serious about modelling and testing.
But since I have little time and getting results I'm very happy with without putting all that effort, quick and dirty is the way for now 🙂
I did some testing of using the Xcites with centrally placed suspension points. I don't have a quick way of testing different suspension points, assembling the frame with the plate takes some time, and didn't want to destroy another plate by taping or gluing on the exciters. So I tried with slightly pressing on the exciters and using moderate levels to avoid distortion, but still got quite high distortion figures and not very smooth FR in the high frequencies. But it does seem like the low mid response is much better, with a deeper and smoother slope. I'm now gluing on the exciters for a proper test plate, and hope that will give me a response I'm satisfied with .
If not I'm not sure how much Chladni would help to inform me of the optimal positions to put suspension? Seems like the first few modes are the most critical to get right, but they are also hard to check with Chladni?
I was a bit surprised that despite not having exact material properties, Erics FEA simulation seems to match quite well what I could see in the FR, so learning to do simulations seem like the best way to avoid having to test random placements hoping to hit the right spots 🙂
I don't think the low frequencies are any harder to test.If not I'm not sure how much Chladni would help to inform me of the optimal positions to put suspension? Seems like the first few modes are the most critical to get right, but they are also hard to check with Chladni?
It does give you insight into which regions are active across the frequency spectrum.
And it's quite entertaining👍
- Home
- Loudspeakers
- Full Range
- A Study of DMLs as a Full Range Speaker
