Moray.
I have talked about the pros and cons of listening to the sides of the panels.
I think burntcoil also talked about this, using his blond panels, I think?
I probably might have made a recording also?
I also talked about this over on nxt rubbish, using my 7ft eps panels.
But where on this forum i do not have a clue 🤔
What is it you wish to know?
PM me if you wish.
You keep sending me likes of lots of my recordings, and I end up going down memory lane, listening to them again.
Making me want to get them out and listen to them again.
I agree, that the recordings do sound very good.
Steve.

Moray, it was Burntcoil's Snow White panels. See
https://www.diyaudio.com/community/...s-as-a-full-range-speaker.272576/post-7147457
and
https://www.diyaudio.com/community/...s-as-a-full-range-speaker.272576/post-7147993
Points 9,10,11
https://www.diyaudio.com/community/...s-as-a-full-range-speaker.272576/post-7147457
and
https://www.diyaudio.com/community/...s-as-a-full-range-speaker.272576/post-7147993
Points 9,10,11
From about 500Hz the sensitivity is actually better by a few dB than my general average, but the HF drops quickly above 4kHz. This means, like other low-density panels, that the midrange is rather strident.The extension in bass is impressive! How is the sensitivity (you get nothing for nothing?)? Does the canvas around the solid panel act as an extension of the panel - like the panel is abruptly thinned out and very flexible?
Very interesting but also hard to grasp what could be happening - like everything related to dml panels afaik.
Greetings, Hans
I think the canvas around the panel acts like a standard speaker surround, and allows the panel itself to move freely, but in a controlled manner.
The driver resonant frequency by itself, is below 100Hz, and there are virtually no harmonics above this frequency that can be transferred out through the back. if one restrains the back of the driver, then this might effect frequencies up to maybe 200Hz if you measure very carefully.maybe during the test try holding onto the back of driver, or add a mass to the back of the driver (maybe doubling it's weight), to see if it has any significant effect on that peak.
Yes, there's definitely a dip between 5kHz or so up to the peak.My first thought when you cut the hole was that the back of the driver is out of phase with the panel and it now has a clear and direct path for that opposite wave to interfere.
Also, just a thought, but maybe that's not a peak at 9kHz, maybe it's a dip from 2kHz - 8kHz 😛
But the above applies only to Albasia. I don't get the same problem on other materials.
I tried filling up the honeycombed cardboard with a resin puck directly in front of the driver, and while it did reduce the broadband peak around 3.5k, it did not give me the HF extension I was looking for. In fact, this seemed to reduce the sensitivity of the whole panel.... I have one more test to try boost the top end on this cardboard. If it doesn't work as I would like, then it's back to the Nidaplast.
thanks I had forgotten about this post great looking loudspeakers. Glad to now make note of this and the info here in. /there are some other posts as well on this topic and I would like to find them as well.Moray, it was Burntcoil's Snow White panels
And now for an almost different subject altogether...
A piece of board (any board, EPS, cardboard, polycarb, PE, etc etc) has a bass response which can be improved by gluing it into a framed canvas panel. I suspect this improved bass response has something to do with the 'surround' created by the space between the inserted board and the hard edge of the frame, and which allows the board to vibrate as a piston at its fundamental frequency.
1. This construction possibly creates a very high QTS driver (consisting of exciter motor, board, surround and frame) which is exactly what is required for open baffle woofers.
Indeed, I tried taking TS parameters using REW, and it seems like the little A3-sized panel I'm testing, with good bass response down to 60hz, has a Qts of 12. This is either very important, or it's wrong.
2. Resonant frequency can be controlled by board weight and canvas tightness. Qts can be controlled by the damping of the surround.
This should make it possible to adjust Fs to the natural frequency of the board by itself, or maybe to that frequency between between the first few modes where you get that inevitable notch on the bass response.
There's much to think about.
Andre, have you tried not to glue the board to the canvas, but just use a small strip of biadhesive foam to glue the outer edges of the board to the canvas? I've tried it some months ago and had good results that way
The problem is that you will have two surfaces which, when resonating, will flap against each other and cause massive odd-harmonic distortion.a small strip of biadhesive foam to glue the outer edges of the board to the canvas?
Hi Andre, I was thinking a similar thing, with the canvas surround the panel at low frequency would be pistonic and the whole thing is similar to a traditional woofer. I wonder if anyone has experimented with different surround materials in a similar manner to the canvas. I can't remember off the top of my head.
Thinking a tensioned (could be adjusted somehow) rubber surround could be used to give forward back flex but also edge damping. I may try with bicycle innertube around a panel in a frame to see if it works.
If I remember correctly people have tried circles and they aren't ideal for DML modes?
Thinking a tensioned (could be adjusted somehow) rubber surround could be used to give forward back flex but also edge damping. I may try with bicycle innertube around a panel in a frame to see if it works.
If I remember correctly people have tried circles and they aren't ideal for DML modes?
How odd that you should mention this now .. I've been mentally churning along this path for many months, and I'm partway thru an experimental build... It's a bit different to the above and I've no idea how it will go yet but I'll let you know either wayAnd now for an almost different subject altogether...
A piece of board (any board, EPS, cardboard, polycarb, PE, etc etc) has a bass response which can be improved by gluing it into a framed canvas panel. I suspect this improved bass response has something to do with the 'surround' created by the space between the inserted board and the hard edge of the frame, and which allows the board to vibrate as a piston at its fundamental frequency.
1. This construction possibly creates a very high QTS driver (consisting of exciter motor, board, surround and frame) which is exactly what is required for open baffle woofers.
Indeed, I tried taking TS parameters using REW, and it seems like the little A3-sized panel I'm testing, with good bass response down to 60hz, has a Qts of 12. This is either very important, or it's wrong.
2. Resonant frequency can be controlled by board weight and canvas tightness. Qts can be controlled by the damping of the surround.
This should make it possible to adjust Fs to the natural frequency of the board by itself, or maybe to that frequency between between the first few modes where you get that inevitable notch on the bass response.
There's much to think about.
Eucy
Houston, we have a problem...

I was running this panel quite hard over the weekend. The driver has started sagging and distorting. I will have to add some kind of brace or support to future drivers.
I was running this panel quite hard over the weekend. The driver has started sagging and distorting. I will have to add some kind of brace or support to future drivers.
Andrewas running this panel quite hard over the weekend. The driver has started sagging and distorting. I will have to add some kind of brace or support to future drivers.
Please, for a quick and simple fix, do try a zip tie anchored to the panel and the back of the exciter by whatever means at hand. The first few I used I wrapped in masking tape to dampen them, now I don't bother.
Works well
Eucy
Thanks, yes, quick and simple fixes are no problem.Andre
Please, for a quick and simple fix, do try a zip tie anchored to the panel and the back of the exciter by whatever means at hand. The first few I used I wrapped in masking tape to dampen them, now I don't bother.
Works well
Eucy
I will be applying solution that would allow the panels to sit comfortably next to Focals or B&W's or something.
FYI Here's a first review of the Tefra DML speaker, with some picture, mistifying descriptions, and measurements.
Like expected, quite uneven FR (looks more uneven than some plots over here, but could be that a different smoothing wideness is used) The reviewers conclusion is that it although it doesn't sound very acurate, there's something special (lively feeling) about it - and I think that is very true.
Tefra sell it at a very high price point....I hope they succeed but it will probably make it more difficult.
Cheers, Hans
https://www.ixbt.com/ds/tefra-audio-nevis-review.html#n8
Measurements...FYI Here's a first review of the Tefra DML speaker, with some picture, mistifying descriptions, and measurements.
I see 25db swings in response, and two drivers, one for low end and one for HF.
Nice, compact design.
On this forum we are often talking about the concept of damping. People will say for example that they did such and such which had some net effect that they attributed to a difference in damping. But it occurred to me that while we often talk about damping, rarely if ever does anyone include test results with clear, direct, evidence that whatever change they have made actually does increase (or reduce) damping. In such cases, how are we to know that it was truly damping that caused the change observed, rather than simply an increase in panel mass, or a change in the constraints that simply shifted the natural frequencies, rather than actually damping anything?
In this and following posts, I want to share several test methods that can be used to get a pretty clear indication of how much damping is actually increased or decreased by a change in a DML/bending wave speaker design. Spoiler alert, none of these methods is a conventional frequency response curve at 1 meter. This is not to say that damping effects do not show up in such a test, but rather that IME there are much better tests for unambiguously detecting the degree of damping in a DML/bending wave speaker construction. What I'm hoping for is to encourage others of you to try these tests, and maybe even show some results of these tests comparing your own builds, especially when you are trying to increase or decrease damping in your designs. Or even if you simply wonder if some change you made actually influenced damping, even though you never intended for that.
In short, the three tests are:
I'll start in this post with the Impedance Test, and demonstrate the other two tests in later posts. Unfortunately, the Impedance Test does require a special "impedance rig" described in the REW help file. It's not too hard to build, but it may be more effort than some of you want to spend. If so, don't worry, because you can get much of the same information from either of the other two tests. I'm starting with the Impedance test mainly because the results are the easiest to plot and compare. Some of you may recall a previous post in which I compared the internal damping of various panel materials, here:
https://www.diyaudio.com/community/...s-as-a-full-range-speaker.272576/post-7499940
For the purposes of demonstrating each of these damping test methods, I constructed five different builds using the same panel but supported five different ways. The panel is a three layer composite with a balsa core and carbon fiber skins, about 2.1 mm thick and with dimensions of 16" x 23.5". In all tests the panel was oriented with the long direction horizontal.
The five mountings are as follows:
1.Hanging Free: Panels were hung from wires attached with small alligator clips, about 5" from the two ends of the panel.
2. Four Points 3M Indoor: Panel attached at four points to a frame using 3M Indoor double sided foam mounting tape. The four points were along the two long edges, about 5" in from the corners. The tape pieces were each approximately 3/4" square. This foam tape is quite soft and rebounds quickly when compressed.
3. Full Surround 3M Indoor: Panel attached to frame around the entire perimeter, excluding about 2" from each corner. The width of tape in contact with the frame and panel was about 0.5" wide.
4. Full Surround 3M Extreme: Similar to directly above, except using 3M Extreme double sided mounting tape. This foam tape is much firmer, and has much slower rebound than the 3M Indoor used in mountings 2 and 3 above.
5. Full Surround Poron 92: Similar to 3 and 4 above except the panel was attached to the frame using Poron 92 foam (about 0.25" thick). This foam is very soft, with very slow rebound. The width of foam in contact with the panel and frame was in this case was about 1.25" wide.
Impedance Test Method and Results
I won't go into all the details of conducting an REW impedance test here, as they can be found in the REW help file. But suffice it to say that it is similar to performing a typical frequency sweep test, except that instead of monitoring the speaker SPL via a microphone, REW monitors the electrical impedance of the panel speaker assembly. The result is a plot of impedance vs. frequency that is similar to what you see in the datasheets for conventional drivers or speakers. The big difference, however, is that instead of seeing just a single peak as you would for a convention speaker driver, the impedance curve of a panel speaker typically exhibits many, many impedance peaks. These peaks each occur at a resonance frequency of the driver/panel/mounting system. And, most importantly, the "defining" effect of damping is that damping widens the frequency range over which a particular resonance mode occurs. When damping is very low, each impedance peak will be concentrated around single frequency, and hence appear as a very tall, narrow and pointy peak in the impedance curve. When damping is higher, the impedance peaks widen, and appear as shorter, wider humps with rounded tops, instead of narrow and pointy peaks. The sharpness of the impedance peaks is the feature that best indicates the relative strength of the damping in a panel speaker system.
The overlay plot below compares the impedance curves for the five panel mountings I described above. For each of these, the exciter used was a DEAX VT25-4, mounted at the 0.4/0.4 position using a thin double sided tape.

Discussion
In each of these curves, the lowest frequency peak, which appears between between about 20 and 32 Hz, is mainly due to the exciter itself, and can be largely ignored for the purposes of comparing damping levels in these panels. But all the other peaks are associated with the resonance modes of the panel itself, as hung or mounted.
As expected, the top curve (Hanging Free) exhibits very sharp peaks, indicating very low damping levels, as expected. Similarly, the second curve from the top (Four Points...) exhibits almost equally sharp peaks, and again indicating very low damping. Even the third curve, despite having been mounted to the frame virtually all the way around the perimeter, still exhibits pretty sharp peaks. Clearly not as sharp as the previous two, but still quite sharp. The fourth curve (Full Surround -3M Extreme) finally shows significant spreading of the impedance peaks, with rounded tops, indicating a clear increase in damping from the previous builds. Finally, the bottom curve (Full Surround - Poron 92) shows even more spreading of the impedance peaks, indicating the greatest level of damping in this set.
Here are a few final notes regarding exciter placement for this test. One is that the height of the peaks (not just the sharpness) is also an indicator of damping (the higher the peaks the lower the damping is). But be aware also that the height of each peak on an individual curve is also determined largely by the location of the exciter on the panel. That is to say, for a particular panel/frame mounting, if you move the exciter, some peaks will get taller, and others will get shorter. That doesn't mean that moving the exciter decreased the damping for one mode, and increased it for the other. Rather, it simply means that you moved the exciter closer to an antinode of one mode, and closer to a nodal line of the other.
A second note is that you can do this test equally well with the exciter at virtually any position on the panel. As I described above, using a different position will excite some modes more effectively (taller peaks) and others less effectively (shorter peaks), but the overall sharpness or roundness of the peaks will remain virtually the same regardless of the exciter position.
Anybody have any similar impedance results to share? Or want to give it a try?
Eric
In this and following posts, I want to share several test methods that can be used to get a pretty clear indication of how much damping is actually increased or decreased by a change in a DML/bending wave speaker design. Spoiler alert, none of these methods is a conventional frequency response curve at 1 meter. This is not to say that damping effects do not show up in such a test, but rather that IME there are much better tests for unambiguously detecting the degree of damping in a DML/bending wave speaker construction. What I'm hoping for is to encourage others of you to try these tests, and maybe even show some results of these tests comparing your own builds, especially when you are trying to increase or decrease damping in your designs. Or even if you simply wonder if some change you made actually influenced damping, even though you never intended for that.
In short, the three tests are:
- Impedance Test
- Tap Test
- Close Mic frequency response
I'll start in this post with the Impedance Test, and demonstrate the other two tests in later posts. Unfortunately, the Impedance Test does require a special "impedance rig" described in the REW help file. It's not too hard to build, but it may be more effort than some of you want to spend. If so, don't worry, because you can get much of the same information from either of the other two tests. I'm starting with the Impedance test mainly because the results are the easiest to plot and compare. Some of you may recall a previous post in which I compared the internal damping of various panel materials, here:
https://www.diyaudio.com/community/...s-as-a-full-range-speaker.272576/post-7499940
For the purposes of demonstrating each of these damping test methods, I constructed five different builds using the same panel but supported five different ways. The panel is a three layer composite with a balsa core and carbon fiber skins, about 2.1 mm thick and with dimensions of 16" x 23.5". In all tests the panel was oriented with the long direction horizontal.
The five mountings are as follows:
1.Hanging Free: Panels were hung from wires attached with small alligator clips, about 5" from the two ends of the panel.
2. Four Points 3M Indoor: Panel attached at four points to a frame using 3M Indoor double sided foam mounting tape. The four points were along the two long edges, about 5" in from the corners. The tape pieces were each approximately 3/4" square. This foam tape is quite soft and rebounds quickly when compressed.
3. Full Surround 3M Indoor: Panel attached to frame around the entire perimeter, excluding about 2" from each corner. The width of tape in contact with the frame and panel was about 0.5" wide.
4. Full Surround 3M Extreme: Similar to directly above, except using 3M Extreme double sided mounting tape. This foam tape is much firmer, and has much slower rebound than the 3M Indoor used in mountings 2 and 3 above.
5. Full Surround Poron 92: Similar to 3 and 4 above except the panel was attached to the frame using Poron 92 foam (about 0.25" thick). This foam is very soft, with very slow rebound. The width of foam in contact with the panel and frame was in this case was about 1.25" wide.
Impedance Test Method and Results
I won't go into all the details of conducting an REW impedance test here, as they can be found in the REW help file. But suffice it to say that it is similar to performing a typical frequency sweep test, except that instead of monitoring the speaker SPL via a microphone, REW monitors the electrical impedance of the panel speaker assembly. The result is a plot of impedance vs. frequency that is similar to what you see in the datasheets for conventional drivers or speakers. The big difference, however, is that instead of seeing just a single peak as you would for a convention speaker driver, the impedance curve of a panel speaker typically exhibits many, many impedance peaks. These peaks each occur at a resonance frequency of the driver/panel/mounting system. And, most importantly, the "defining" effect of damping is that damping widens the frequency range over which a particular resonance mode occurs. When damping is very low, each impedance peak will be concentrated around single frequency, and hence appear as a very tall, narrow and pointy peak in the impedance curve. When damping is higher, the impedance peaks widen, and appear as shorter, wider humps with rounded tops, instead of narrow and pointy peaks. The sharpness of the impedance peaks is the feature that best indicates the relative strength of the damping in a panel speaker system.
The overlay plot below compares the impedance curves for the five panel mountings I described above. For each of these, the exciter used was a DEAX VT25-4, mounted at the 0.4/0.4 position using a thin double sided tape.
Discussion
In each of these curves, the lowest frequency peak, which appears between between about 20 and 32 Hz, is mainly due to the exciter itself, and can be largely ignored for the purposes of comparing damping levels in these panels. But all the other peaks are associated with the resonance modes of the panel itself, as hung or mounted.
As expected, the top curve (Hanging Free) exhibits very sharp peaks, indicating very low damping levels, as expected. Similarly, the second curve from the top (Four Points...) exhibits almost equally sharp peaks, and again indicating very low damping. Even the third curve, despite having been mounted to the frame virtually all the way around the perimeter, still exhibits pretty sharp peaks. Clearly not as sharp as the previous two, but still quite sharp. The fourth curve (Full Surround -3M Extreme) finally shows significant spreading of the impedance peaks, with rounded tops, indicating a clear increase in damping from the previous builds. Finally, the bottom curve (Full Surround - Poron 92) shows even more spreading of the impedance peaks, indicating the greatest level of damping in this set.
Here are a few final notes regarding exciter placement for this test. One is that the height of the peaks (not just the sharpness) is also an indicator of damping (the higher the peaks the lower the damping is). But be aware also that the height of each peak on an individual curve is also determined largely by the location of the exciter on the panel. That is to say, for a particular panel/frame mounting, if you move the exciter, some peaks will get taller, and others will get shorter. That doesn't mean that moving the exciter decreased the damping for one mode, and increased it for the other. Rather, it simply means that you moved the exciter closer to an antinode of one mode, and closer to a nodal line of the other.
A second note is that you can do this test equally well with the exciter at virtually any position on the panel. As I described above, using a different position will excite some modes more effectively (taller peaks) and others less effectively (shorter peaks), but the overall sharpness or roundness of the peaks will remain virtually the same regardless of the exciter position.
Anybody have any similar impedance results to share? Or want to give it a try?
Eric
Well damnation, I've yet to find an upmarket zip tie! 🤭Thanks, yes, quick and simple fixes are no problem.
I will be applying solution that would allow the panels to sit comfortably next to Focals or B&W's or something.
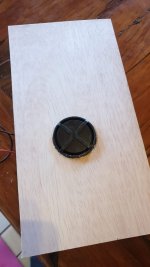
This was just a quick test to see of the hole saw was the right size. I'll build rear panels (both for driver support and for an air-spring effect) to fit across the back of the panel.But I'm very interested in seeing your solution !!👍
And, given @Veleric 's post on damping, I'll also check to see what effects this rear panel will have on resonances and on the impedance curve.
Attachments

- Home
- Loudspeakers
- Full Range
- A Study of DMLs as a Full Range Speaker