Hi Vineeth,
as I‘m quite impressed with your Dirac FIR results, please describe a bit more:
What was the mic distance?
Did you implement the x-over before running Dirac?
What was the Dirac FIR measurements Procedere?
I‘m in the process to decide for a Flex Eight…
Thanks!
Winfried
as I‘m quite impressed with your Dirac FIR results, please describe a bit more:
What was the mic distance?
Did you implement the x-over before running Dirac?
What was the Dirac FIR measurements Procedere?
I‘m in the process to decide for a Flex Eight…
Thanks!
Winfried

Just for clarity DRC-FIR is not Dirac, it is a freeware program from Dennis SbragionI‘m quite impressed with your Dirac FIR results, please describe a bit more:
https://drc-fir.sourceforge.net/
So more tests and listening impressions from little time I got so far in the morning.. 😀
Here are the EQ profiles I have tested so far. To reduce the clutter, I am showing only the responses of the right speaker under different EQ profiles in DRC designer software. The profiles that I have tried (using DRC designer) so far are the following (also each time a slightly different target curve)
1) Strong
2) Minimal
3) Soft
Snapshots from DRC designer options window:

Corresponding responses I got from main listening position for the right speaker

Among what I have tried so far, I liked the 'soft' option with the following target curve the best.. 😀

Here are the responses I got for that setting for left and right speakers (also plotted are the unEQd responses for comparison) 🙂

Since these are got using single point correction (from mic at the mainlistening position (MLP)), I was curious as to what happens a bit away in horizontal plane with this EQ 😀
So I measured the responses one foot away to the left of the MLP at the same height for both speakers. Here are the comparison plots

Trying to reduce clutter and show the response at one foot away from MLP alone (I feel it is still really good except for some added bumpiness from 300 - 500 Hz)

In all cases, the step responses look nice with varying (but still very very small and inaudible to me) amounts of pre-ringin. Comparison of step responsesfor different profiles (no EQ, strong, minimal, soft)

No EQ vs soft EQ

Now step responses from MLP vs 1 foot away from MLP

I think this is all amazing and whoever desgined these softwares should be given an award or something. And to offer it all this capability to public for free, I dont know what to say but they have been extremely generous. 🙂
As I said above, I liked the soft EQ option the best so far. I think part of it is due to the bass balance w.r.t overall levels across bandwidth.. 🙂
I listened to 2-3 more songs. The system seems to take EQ like breeze. Seems like it is putting no extra effort. 😀 But the results are extemely nice. Solid imaging. Well controlled bass. I dont hear any loss in overall dynamics (except the reduction of a bit of boom in the bass). I really like it all... Now I am a beleiver in Room EQ too 😀
Still need to test more.. I feel there is a little bit of image shift (which is more identifiable now) if I move significantly to the left or right of MLP even with the 45 degree toe in of speakers. But at MLP it sounds very very nice. 🙂
Sometimes I wonder if there is no end to this... 😀 But it is ok I guess, keeps me occupied and extremely interested in all this.
@fluid : thanks a lot for pointing out this software to me.. 🙂 If you have experimented with all these different EQ options, could you tell me which one you liked best at least the one which you use more often. I understand that yours is a very special speaker compared to mine in terms of directivity and other factors, but which EQ profile and spectral balance have you liked the most..
Here are the EQ profiles I have tested so far. To reduce the clutter, I am showing only the responses of the right speaker under different EQ profiles in DRC designer software. The profiles that I have tried (using DRC designer) so far are the following (also each time a slightly different target curve)
1) Strong
2) Minimal
3) Soft
Snapshots from DRC designer options window:
Corresponding responses I got from main listening position for the right speaker
Among what I have tried so far, I liked the 'soft' option with the following target curve the best.. 😀
Here are the responses I got for that setting for left and right speakers (also plotted are the unEQd responses for comparison) 🙂
Since these are got using single point correction (from mic at the mainlistening position (MLP)), I was curious as to what happens a bit away in horizontal plane with this EQ 😀
So I measured the responses one foot away to the left of the MLP at the same height for both speakers. Here are the comparison plots
Trying to reduce clutter and show the response at one foot away from MLP alone (I feel it is still really good except for some added bumpiness from 300 - 500 Hz)
In all cases, the step responses look nice with varying (but still very very small and inaudible to me) amounts of pre-ringin. Comparison of step responsesfor different profiles (no EQ, strong, minimal, soft)
No EQ vs soft EQ
Now step responses from MLP vs 1 foot away from MLP
I think this is all amazing and whoever desgined these softwares should be given an award or something. And to offer it all this capability to public for free, I dont know what to say but they have been extremely generous. 🙂
As I said above, I liked the soft EQ option the best so far. I think part of it is due to the bass balance w.r.t overall levels across bandwidth.. 🙂
I listened to 2-3 more songs. The system seems to take EQ like breeze. Seems like it is putting no extra effort. 😀 But the results are extemely nice. Solid imaging. Well controlled bass. I dont hear any loss in overall dynamics (except the reduction of a bit of boom in the bass). I really like it all... Now I am a beleiver in Room EQ too 😀
Still need to test more.. I feel there is a little bit of image shift (which is more identifiable now) if I move significantly to the left or right of MLP even with the 45 degree toe in of speakers. But at MLP it sounds very very nice. 🙂
Sometimes I wonder if there is no end to this... 😀 But it is ok I guess, keeps me occupied and extremely interested in all this.
@fluid : thanks a lot for pointing out this software to me.. 🙂 If you have experimented with all these different EQ options, could you tell me which one you liked best at least the one which you use more often. I understand that yours is a very special speaker compared to mine in terms of directivity and other factors, but which EQ profile and spectral balance have you liked the most..
Attachments
Last edited:
As fluid said above, I am using DRC designer, which internally uses DRC FIR. It is extremely easy to use.Hi Vineeth,
as I‘m quite impressed with your Dirac FIR results, please describe a bit more:
What was the mic distance?
Did you implement the x-over before running Dirac?
What was the Dirac FIR measurements Procedere?
I‘m in the process to decide for a Flex Eight…
Thanks!
Winfried
If you are interested in this software and have trouble using it, take a look at this video. It very clearly explains how to use the tool.
My mic distance is 3m away from each speaker (at the main listening position).
The distance between speakers is about 2+m.
My crossover uses EQ apo and is designed based on horizontal polar measurements I made in REW and, subsequently, vituixCAD for crossover design.
You are welcome 🙂 I don't and have never used DRC Designer, although it is a front end for DRC-FIR. I use custom script's based on gmad's that I think I linked before. While this is not as easy to get started with it allows access to all the options and after an adjustment period is considerably quicker to generate alternative filters with small differences.@fluid : thanks a lot for pointing out this software to me.. 🙂 If you have experimented with all these different EQ options, could you tell me which one you liked best at least the one which you use more often. I understand that yours is a very special speaker compared to mine in terms of directivity and other factors, but which EQ profile and spectral balance have you liked the most..
My advice is to make your own that has the features you want to target. The problem with the stock options is that you may not want all of the options in the stronger correction but some of them might be useful. I would advise to keep the window length short in the mid range and experiment with lengthening it in the bass. You set the window lengths based on a value at low frequency a value at high frequency and a window exponent which changes the curve shape in between.
I can see that DRC Designer is using the logarithmic interpretation of the target curve in the screenshots. I don't like this as the target you get is not actually what you asked for.
I can help you with the scripts but not with the Designer front end.
Dirac in MinDSP software cannot do all that DRC-FIR can do and the tap lengths are very limited due to the hardware.
Thanks fluid.. I will definitely need some help in designing the filters using the scripts. At the moment I dont know how to run the software itself from command line on windows.
I tried to use the steps in gmad's thread which you had linked in one of the posts in the past. I read the first 5 pages of the thread and then thought i will start to try out the software. But then I got confused after reading the text files in the guide folder in his zipped file. I understood till the place where he explained about getting the pcm files for left and right channel impulse responses. In the creating correction filters part, I was confused about what commands I should use to design the filters and how to control the different parameters including windowing. This is why I started using DRC designer. And its GUI eas easier to use. But I also saw that the target curve I got is not exactly what i had asked for even though what I got was still nice.. 😀
I am thinking now that I might have missed some part of the user guide where gmad has given more detailed steps? Can you please let me know if there are more detailed steps somewhere in his zipped file or some other post in that thread? If such a thing is not available, can you please help me with figuring out how to use the command window to go to the appropriate folder and then maybe a sample command that I can run to understand the process?
EDIT: I just saw that there is a lot of information about scripts towards the later part of that thread.. Seems like I need to read the full thread to get a sense of how the scripting looks like.. 🙂
Last edited:
It's been awhile since I did it myself so give the oil a while to work through my brain and see if I can help simplify it for you. Nothing about it is difficult but it is complicated.
Edit: Yes read the whole thread, there is a lot of good stuff in there, and some of gmad's own preset's would be worth a try.
Edit: Yes read the whole thread, there is a lot of good stuff in there, and some of gmad's own preset's would be worth a try.
Last edited:
The text guide is only to get started and use an existing script. There is much more information in the thread to explain what things you might want to change. The DRC FIR documents explain all the commands or options that can be specified and if they have interaction with others. It is important to read it as certain window sizes require others to be related in a certain way otherwise drc will throw an error.
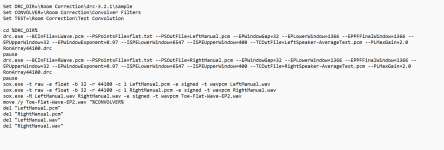
Attached is a screenshot of a script. Anything with -- in front of it is a command that is being called and varied from the one in the drc file. You could edit the drc file directly with the change but I find it easier to change in a separate script. The script contains sox options to turn the filter files into wav files that can be used directly with a convolution program. drc outputs raw pcm by itself. There is also a test convolution that can be opened to inspect what will happen, no need to measure again to see if it did what you wanted or not.
If you look in the sample folder inside the drc folder there should be some files that end in .drc like strong.drc etc. Open one of these in a text editor and you will see the options being used with that correction. You can compare it to the minimal or other examples.
The items that start with MP define the minimum phase frequency dependent windowing stage.
PSInterpolationType = will set that way the target response refers to the target points file. Read the manual to see the options, R works quite well from memory in matching how the text file of points looks in REW.
You will see in mine that the points file is flat. I don't use drc to set the final shape. I do that with shelving PEQ, I 've described it a few times if you haven't seen it I can explain again. DRC returns a flat response and I shape it myself afterwards. I found this to work better in adjusting the drc parameters independently of the tonal balance I wanted to keep and small changes in PEQ were easier to dial in in real time while listening.
Attachments
Thanks a lot, @fluid, for the above instructions and interpretation of different parameters/commands.
With the above, I think I am able to understand the scripting part a bit more now 🙂 I will try it out.
I am reading through the thread slowly, and probably when I read through it more, I will understand the DRC-related settings/parameters even better, I guess. I will go through the documentation too.
So from what you described above, I should target a flat response with DRC (instead of the current tilted response I am using) and then shape the spectral balance using PEQ in the convolved. I will try this out.
I find it easier to set the two things independently of each other, it becomes time consuming and annoying constantly tweaking the target.
It looks like this the dots are the centre frequencies of the shelving filters, most spaced an octave apart from each other. You can set the rate of fall by the amplitude and tweak the slope up or down at different points with the Q.

It looks like this the dots are the centre frequencies of the shelving filters, most spaced an octave apart from each other. You can set the rate of fall by the amplitude and tweak the slope up or down at different points with the Q.
Do you measure in one place to get that curve? What happens if you move the mic 20-30cm and measure again - after corrections?So more tests and listening impressions from little time I got so far in the morning.. 😀
Here are the EQ profiles I have tested so far. To reduce the clutter, I am showing only the responses of the right speaker under different EQ profiles in DRC designer software. The profiles that I have tried (using DRC designer) so far are the following (also each time a slightly different target curve)
1) Strong
2) Minimal
3) Soft
Snapshots from DRC designer options window:
View attachment 1156686
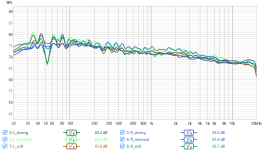
Corresponding responses I got from main listening position for the right speaker
View attachment 1156685
Among what I have tried so far, I liked the 'soft' option with the following target curve the best.. 😀
View attachment 1156687
Here are the responses I got for that setting for left and right speakers (also plotted are the unEQd responses for comparison) 🙂
View attachment 1156688
Since these are got using single point correction (from mic at the mainlistening position (MLP)), I was curious as to what happens a bit away in horizontal plane with this EQ 😀
So I measured the responses one foot away to the left of the MLP at the same height for both speakers. Here are the comparison plots
View attachment 1156690
Trying to reduce clutter and show the response at one foot away from MLP alone (I feel it is still really good except for some added bumpiness from 300 - 500 Hz)
View attachment 1156691
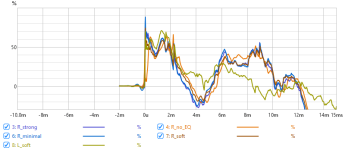
In all cases, the step responses look nice with varying (but still very very small and inaudible to me) amounts of pre-ringin. Comparison of step responsesfor different profiles (no EQ, strong, minimal, soft)
View attachment 1156696
No EQ vs soft EQ
View attachment 1156695
Now step responses from MLP vs 1 foot away from MLP
View attachment 1156697
I think this is all amazing and whoever desgined these softwares should be given an award or something. And to offer it all this capability to public for free, I dont know what to say but they have been extremely generous. 🙂
As I said above, I liked the soft EQ option the best so far. I think part of it is due to the bass balance w.r.t overall levels across bandwidth.. 🙂
I listened to 2-3 more songs. The system seems to take EQ like breeze. Seems like it is putting no extra effort. 😀 But the results are extemely nice. Solid imaging. Well controlled bass. I dont hear any loss in overall dynamics (except the reduction of a bit of boom in the bass). I really like it all... Now I am a beleiver in Room EQ too 😀
Still need to test more.. I feel there is a little bit of image shift (which is more identifiable now) if I move significantly to the left or right of MLP even with the 45 degree toe in of speakers. But at MLP it sounds very very nice. 🙂
Sometimes I wonder if there is no end to this... 😀 But it is ok I guess, keeps me occupied and extremely interested in all this.
@fluid : thanks a lot for pointing out this software to me.. 🙂 If you have experimented with all these different EQ options, could you tell me which one you liked best at least the one which you use more often. I understand that yours is a very special speaker compared to mine in terms of directivity and other factors, but which EQ profile and spectral balance have you liked the most..
What I'm digging at, is whether the corrections in the software can differentiate between corrections correlated to the speaker and the room - respectively. Or is it a setting which you compromise between average or maybe 20% speaker and 80% room - something like that?
@digitalthor: To get the above curves, I measured only from the main listening position.
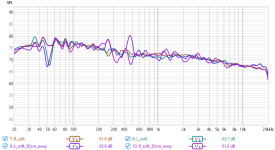
I have also shown a set of plots with the correction on and measurements taken (for left and right speaker) 30cm to the left of the main listening position. Here is that plot

Apart from the little bit of bumpiness arpund 300 to 500 Hz region, i think it looks close to that at MLP
I have also shown a set of plots with the correction on and measurements taken (for left and right speaker) 30cm to the left of the main listening position. Here is that plot
Apart from the little bit of bumpiness arpund 300 to 500 Hz region, i think it looks close to that at MLP
Everything you asked was well presented a bit earlier!Do you measure in one place to get that curve? What happens if you move the mic 20-30cm and measure again - after corrections?
What I'm digging at, is whether the corrections in the software can differentiate between corrections correlated to the speaker and the room - respectively. Or is it a setting which you compromise between average or maybe 20% speaker and 80% room - something like that?
https://www.diyaudio.com/community/threads/a-3-way-design-study.376620/post-7304456
I recorded a video of speakers playing a video from youtube (with the current version of room EQ ON, which is DRC designer soft profile).. 😛
I don't know why I keep doing this recording thing, knowing that it is probably useless for anybody else to judge anything about the system. 🙄
But I still keep doing it out of excitement.. 😀
Maybe it will help someone reading this thread someday to get a bit more complete picture of the whole thing other than just seeing the graphs, getting bored, and running away from this thread.. 😀
PS: There is some hiss in the video due to some high noise floor (or maybe low SNR due to less signal level) in the recording device that I used (my phone 😛)
This is what the frequency dependent window settings affect. A short time window is speaker, long time window speaker and room. Varying the length with frequency let's you choose how much to have at different frequency ranges. The "stronger" correction has more positional dependance.What I'm digging at, is whether the corrections in the software can differentiate between corrections correlated to the speaker and the room - respectively. Or is it a setting which you compromise between average or maybe 20% speaker and 80% room - something like that?
I recorded a video of speakers playing a video from youtube (with the current version of room EQ ON, which is DRC designer soft profile).. 😛
I don't know why I keep doing this recording thing, knowing that it is probably useless for anybody else to judge anything about the system. 🙄
But I still keep doing it out of excitement.. 😀
Maybe it will help someone reading this thread someday to get a bit more complete picture of the whole thing other than just seeing the graphs, getting bored, and running away from this thread.. 😀
“My task, which I am trying to achieve is, by the power of the recorded video, to make you see, to make you feel--it is, before all, to make you hear”
Vineeth Kumar
😀
😛
@tktran303: Why not... It is more fun 😛 😛 😀
Maybe someday, a better medium or a better perceptually easy-to-relate-to metric will come along for these kinds of things.. 😀
(And I have been a little inspired by xrkaudio's youtube videos showing even his foam-core speakers playing. His builds were one of my initial inspirations to start building some speakers.. 😀 )
^ me too, Xrk is a source of inspiration for many i think.
You could do binaural recordings if you really want to share your listening impressions ( interesting reading and with example of what you could expect):
https://audiophilestyle.com/ca/reviews/kevin-schmidt-we-are-the-robots-exhibit-review-r742/
You could do binaural recordings if you really want to share your listening impressions ( interesting reading and with example of what you could expect):
https://audiophilestyle.com/ca/reviews/kevin-schmidt-we-are-the-robots-exhibit-review-r742/
Thank you. It was exactly the position of the mic, that I was in doubt about, since you did write that you measured a foot to the left and right(shows in the picture you posted - REW details) at the same height. But I often find bigger differences in the bass, like you, when measuring half a meter to both left, right, forth and back of the MLP - also slightly different heights. Maybe your room is more symmetrical than mine...@digitalthor: To get the above curves, I measured only from the main listening position.
I have also shown a set of plots with the correction on and measurements taken (for left and right speaker) 30cm to the left of the main listening position. Here is that plot
View attachment 1157095
Apart from the little bit of bumpiness arpund 300 to 500 Hz region, i think it looks close to that at MLP
My current speakers are measuring a lot like yours in my MLP -with no DRC and just a natural beaming because of the design of the drives and speakers. But I applaud your work, and I myself love what modern software, computers and algorithms can bring us.
The experience I have with DRC, is that mostly the upper frequencies - above ~500Hz - will remain unaffected, when the speaker has a smooth and even power response to begin with. But if the speaker has issues in its basic design, then DRC can only smooth them out, never really fix them. Which results in smoother - sometimes - averaged curves - our ears like that though - but I also experienced that details get lost in that process, from measuring in the MLP to measuring the speaker in total (or close) independence of the room.
My experience over the years, is that all the speakers I like the most(all price ranges and sizes), are the ones with an even power response - where the downward tilt - as frequency rises - is a result of a good match between midrange and tweeter, both in size and dispersion, so that a constantly increasing beaming occurs, as frequency goes up. Because then you will measure a sum of direct sound and reflected sound in the MLP, giving you that natural tilt. This is where I often experience the best stereo imaging.
I played around with direct radiating tweeters vs WG tweeters, and their dispersion is key to stereo imaging. My claim is, that you might be able to make a downward tilt and let DRC create a filter/EQ that gives you a nice curve in the MLP. But DRC can never change the dispersion of a driver or specific speaker design. This is exactly what I tried with a Seas DXT and T34B - the DXT had a nice pinpoint image right between the speakers - whereas the Bliessma just illuminated the room with sound - smearing any chance of pinpointing anything. No type of EQ can ever fix basic physical features of drivers and speaker cabinets.
@Juhazi - I still needed clarification though 😊
@fluid - And I guess the "soft" setting has an influence to this as well? Because - there must be some level of detail degradation in play, when measuring further away from the speaker - right?
@krivium: Thanks for the link. I will read it.. 🙂
I just checked the price of a binaural mic (Sennheiser ambeo) and it costs more than my speakers.. 😲 So I am not eager to buy it at the moment. But maybe someday... I actually badly want an earthworks measurement mic more than a recording mic at the moment I think. 😀
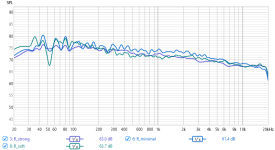
@digitalthor: Thanks for the encouragement and your insights on the effects of DRC. I have to move around more and experiment with listening I guess to know what exactly are the effects of the DRC at other places compared to MLP. Right now this is my quasi-anechoic measurements-based spin data (only based on horizontal polar measurements) from VituixCAD

The predicted in-room response slopes down at a rate of about 1 dB to 1.4 dB from about 500 Hz onwards. Power response looks sloping down and relatively smooth but I don't know what tilt of that is the best choice. This what I currently have sounds nice though... 🙂
I just checked the price of a binaural mic (Sennheiser ambeo) and it costs more than my speakers.. 😲 So I am not eager to buy it at the moment. But maybe someday... I actually badly want an earthworks measurement mic more than a recording mic at the moment I think. 😀
@digitalthor: Thanks for the encouragement and your insights on the effects of DRC. I have to move around more and experiment with listening I guess to know what exactly are the effects of the DRC at other places compared to MLP. Right now this is my quasi-anechoic measurements-based spin data (only based on horizontal polar measurements) from VituixCAD
The predicted in-room response slopes down at a rate of about 1 dB to 1.4 dB from about 500 Hz onwards. Power response looks sloping down and relatively smooth but I don't know what tilt of that is the best choice. This what I currently have sounds nice though... 🙂
- Home
- Loudspeakers
- Multi-Way
- A 3 way design study