I'm confused about your off-axis angle numbering. The graph says -180 to 180° but the data look more like -90 to 90°. Also the DI comes out suspiciously low. Did you really measure the full circle, front to back, or just the front hemisphere?

Thanks @mabat for pointing this out.
We realized that @WetFartz got a little confused with the rotation setup.
So what he has actually measured is measurements from 0 degrees to 90 degrees in steps of 5 degrees instead of 0 to 180 in steps of 10 degrees
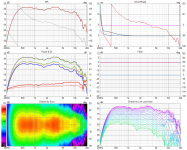
Corrected raw measurements for Rosso 65 CDN-T

Normalized directivity plots and unequalized responses for the Rosso driver

Responses with a bit of passband shaping EQ


We realized that @WetFartz got a little confused with the rotation setup.
So what he has actually measured is measurements from 0 degrees to 90 degrees in steps of 5 degrees instead of 0 to 180 in steps of 10 degrees
Corrected raw measurements for Rosso 65 CDN-T
Normalized directivity plots and unequalized responses for the Rosso driver
Responses with a bit of passband shaping EQ
Attachments
Corrected raw response for the HF 146 (measured today)

Vituixcad plots for unequalized response (reference axis is 15 degree off axis)

Response with a bit of EQ

Equalized response Comparison between HF 146 & Rosso 65CDN-T (EQ applied on both with 15 degrees off axis as reference axis. This doesn't make much sense but just posting for fun.. 😀
HF146 on mk3b2

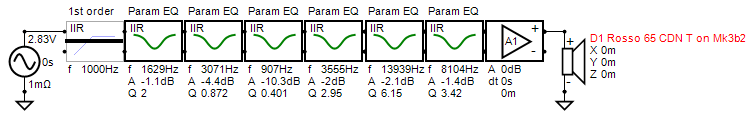
Rosso 65CDN-T on mk3b2

Vituixcad plots for unequalized response (reference axis is 15 degree off axis)
Response with a bit of EQ
Equalized response Comparison between HF 146 & Rosso 65CDN-T (EQ applied on both with 15 degrees off axis as reference axis. This doesn't make much sense but just posting for fun.. 😀
HF146 on mk3b2
Rosso 65CDN-T on mk3b2
Attachments
HF146 axial response (0 degrees on axis response) flattened using REW Auto EQ

Corresponding spectrogram

Rosso 65CDN-T axial response (0 degrees on axis response) flattened using REW Auto EQ

Corresponding spectrogram

Corresponding spectrogram
Rosso 65CDN-T axial response (0 degrees on axis response) flattened using REW Auto EQ
Corresponding spectrogram
Were specific vertical measurements made or are these mirrored horizontal?
To me it indeed seems that above 7 kHz (where the input wavefront doesn't remain flat enough anymore) a lot of the energy is trapped inside and around the fins (it can even circulate). There's no reason why there should be so much stored and slowly decayed energy below the driver's break-up. I just can't help myself, this seems to me as a dead end. Would be interesting to see it without the fins.
I dont know about the stored energy part. It could even be from material used for construction..
By now we have realized that this kind of PLA based construction is not what we want to pursue any further for any horn.
By now we have realized that this kind of PLA based construction is not what we want to pursue any further for any horn.
Do you have a raw measurement of the CD to see it's spectrogram without the horn?
Yea, the bulkier it gets, the more PITA it is... It's not easy to make big horns.By now we have realized that this kind of PLA based construction is not what we want to pursue any further for any horn.
With a CD without any horn (i.e. without a proper acoustic termination) there will be a lot of reflected (stored and decayed) energy as well. That's not a very good comparison.
Build it again, this time without the fins 😀 (just kidding!)
Build it again, this time without the fins 😀 (just kidding!)
Foam, flelt or fibreglass around the faceplate can help with adding a soft termination.@fluid: We haven't taken raw measurement of the CD yet. Will try to take it soon..
😮 how did you manage to pick out a post from 2008!
To get somewhat of a basic education (next to reading the right type of books) I have read literally all posts by Dr. Geddes, Tom Danley, David Smith and a few others...
Lucky for me, I have a very good memory, next it's just to type in the right key words and hit search 😉.
@WetFartz , @vineethkumar01, you can also try to measure the horn with fin channels filled with some sparse damping.
It surely will. But even now it's lower than what it's supposed to be (roughly by 3 dB), even if it was axisymmetric with the polars shown - I guess that's given by the way VituixCad calculates this when it doesn't have the full-circle data. It's nothing wrong, one just have to be aware of this.The overall DI will rise more towards high frequencies when the vertical is included.
@WetFartz @vineethkumar01 I'm amazed at how fast you did that. Nice work.
Even though both drivers have very different loaded impedance curves (<1Khz) the results are about the same.
How much EQ are you applying in the spectrogram charts (>10K) as this can lift the noise floor as well. In some cases it appears as much as 20dB. Is there an EQ curve? I'm assuming you did this after the measurement was taken.
@WetFartz sure puts in a lot of hardwork and works fast.. 🙂
@DonVK : When I used REW autoEQ, I selected the target response in such a way that it will cause cuts mostly. So yes, as you said there are even 10dB cuts at places. Here is a plot showing the actual response, filters, and the EQed response

I thought that some SNR reuction might have happened with this but I thought we are high enough above noise floor so never checked it yet. How do we know how much SNR we have in the measurement?
Here is a plot showing the noise floor & distortion componenets from the above on axis measurement. It seems like we still have more than 60dB of SNR (only comparing with noise floor) above 4kHz

@DonVK : When I used REW autoEQ, I selected the target response in such a way that it will cause cuts mostly. So yes, as you said there are even 10dB cuts at places. Here is a plot showing the actual response, filters, and the EQed response
I thought that some SNR reuction might have happened with this but I thought we are high enough above noise floor so never checked it yet. How do we know how much SNR we have in the measurement?
Here is a plot showing the noise floor & distortion componenets from the above on axis measurement. It seems like we still have more than 60dB of SNR (only comparing with noise floor) above 4kHz
- Home
- Loudspeakers
- Multi-Way
- 2-way horn system based on the MK3B2