Just looked at spec sheet, 40 sounded way high. Quiescent current is 4-5ma. 40ma is the max short circuit current of the output drivers, which would of course consume 40ma of supply current. I suspect you will draw very near 5ma as the load is probably around 5K and swing will be a volt or 2. So basically nothing. I'd think the P/S could afford an extra 10ma load on it. (2X OPA134PA)
Well that's great news, and it would make the installation very simple 🙂
Just got to work out some more understanding in the REW software to be sure I have the right design values
simple circuit?
All posted plans are over-complicated, IMHO.
First time I did what you are doing, I did this, and never regretted it. (The console was used by dozens of people for dozens of years no complaints.)
You do not need regulation. Your likely chips will work as low as +/-6V or to almost +/-18V. They will reject huge ripple. The large caps put ripple down near 1/4 millivolt; add the 60+dB PSRR in any good audio opamp, the buzz is below the hiss.
Large supplies "like" full wave rectifiers to reduce cap size/cost. But at this power level the 2-diode plan reduces cost and simplifies wiring.
Attachments
You are talking about the filter?Just got to work out some more understanding in the REW software to be sure I have the right design values
You can quickly set it up in LTSpice (with any opamp found in the SW; it is just a buffer here)
Even better when you know output impedance of preamp and input impedance of the sub amp.
On the Linkwitz site you´ll find a spreadsheet for exactly that kind of filter if you don´t want to work with a Spice program.
See point #7 here:
Active Filters
The spreadsheet is the first linked in the top paragraph:
https://www.linkwitzlab.com/Linkwitz%20Filter%20Circuits%20Tool%20V4.1.xls
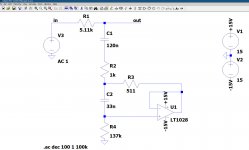
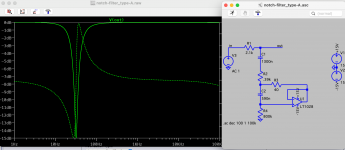
If you want to use LTSpice here´s the simulation file for the "notch filter Type A" as per your and Linkwitz schematic.
This is fantastic, thanks - I have downloaded LT Spice but not yet got my head around it....
Use something like this, PSU by Myrra, type 47254, output 2x12V or 47247, 2x15V. Add simple LC filters at outputs ( e.g 220uH, 47uF). Nothing more needed for few OA.
Last edited:
You´re welcome. Took me 3min. and it nicely takes my mind off work😉This is fantastic, thanks - I have downloaded LT Spice but not yet got my head around it....
For now you just have to click "simulate" (that small running person) and then on the "out"-node to see the response in [dB] and phase because it is an AC-simulation.
You´ll get the hang of the SW slowly but surely.
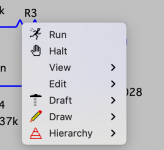
For some strange reason I can't seem to change the values in the model, I am right hand clicking effectively with an apple trackpad and all I get on screen is this image? I am sure these were accessible to change when I first started playing?
Attachments
^^^^^THATYou do not need regulation. Your likely chips will work as low as +/-6V or to almost +/-18V. They will reject huge ripple. The large caps put ripple down near 1/4 millivolt; add the 60+dB PSRR in any good audio opamp, the buzz is below the hiss
Personally I´m Cheap/Minimalist (pick one or both 😉 ) and never ever use regulators with Op Amps, they simply don´t pick (reasonable) ripple.
My typical supplies are either derived from +/-V power amp rails (and you very well could/should do that): 2 resistors 2 15/6V Zeners 2 capacitors (100uF are enough, remember main supply is already filtered) OR a single or dual 12VAC winding, 2 diodes (doubler) or a bridge and 2 caps, which in this case yes, need to be "substantial" (2 x 2200uF 😉 )
An added RC net is the icing on the cake.
PS: remember Zeners if used also *chop* ripple off.
Last edited:
ltspice for mac(book) editing components. | All About CircuitsFor some strange reason I can't seem to change the values in the model
Does that help? Was the first link on google BTW ;-)
Otherwise there is a BIG thread about LTSpice here and I´m sure there´s MAC users.
You´re welcome. Took me 3min. and it nicely takes my mind off work😉
For now you just have to click "simulate" (that small running person) and then on the "out"-node to see the response in [dB] and phase because it is an AC-simulation.
You´ll get the hang of the SW slowly but surely.
Ahh ok, think I am getting somewhere....does this make sense as a pathway.
(I am not sure how to calculate the Q in REW mathematically)
I create a filter like this in LT spice, and then compare to the filter selected to work theoretically in REW (dB at frequency) to see how to build the filter in LT spice that matches the REW curve.....that removes the room mode mostly from the measured room response.
Then build one and find out if theory matches prediction 🙂
Attachments
I´d guess the notch has to have the same shape as the resonance.
So you would need the absolute attenuation and the "width" of the resonance.
Look at the definition of Q for the notch on Linkwitz drawing.
Determine delta-f at -3dB down. Then Q =f0/delta-f.
You can put these numbers into the spreadsheet I linked above, then put those part values in LTSpice.
And yes, the rest is fine-tuning I suppose.
You´re welcome. Took me 3min. and it nicely takes my mind off work😉
For now you just have to click "simulate" (that small running person) and then on the "out"-node to see the response in [dB] and phase because it is an AC-simulation.
You´ll get the hang of the SW slowly but surely.
I´d guess the notch has to have the same shape as the resonance.
So you would need the absolute attenuation and the "width" of the resonance.
Look at the definition of Q for the notch on Linkwitz drawing.
Determine delta-f at -3dB down. Then Q =f0/delta-f.
You can put these numbers into the spreadsheet I linked above, then put those part values in LTSpice.
And yes, the rest is fine-tuning I suppose.[/QUOT
Yeah I get a value if the notch design in REW playing with F(notch) dB and Q and look at the filter design to match -3dB frequency in REW and creating the equivalent in LT Spice.....then checking on the xls calculator.....and thinking through the accuracy/sensitivity analysis.
For some reason I struggle to get a high Q on the LT Spice, but I am just empirically guessing.....
Why estimate when you can use the spreadsheet?
One of the parameters you have to give is the delta-f.
Those values from the spreadsheet should fit.
One of the parameters you have to give is the delta-f.
Those values from the spreadsheet should fit.
Why estimate when you can use the spreadsheet?
One of the parameters you have to give is the delta-f.
Those values from the spreadsheet should fit.
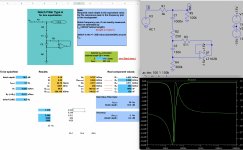
For whatever reason the spreadsheet in my hand does not predict the right Q
See comparison here with LT Spice?
Attachments
I´ll look into this in detail later.
Judging from your REW plot in post #32 your delta-f is ~10Hz as far as I can make that out.
You should put that into the spreadsheet (where do the 64,2Hz come from?).
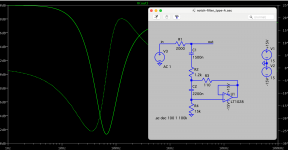
To complicate things a little more, this circuit assumes an input source with 0R output resistance and the following amp with infinite resistance.
You will have to put in an Rload which represents the input resistance of your sub-amplifier.
Just add an "R" by pressing R, add GND by pressing G and wire after pressing F3 (in my windows version at least).
Also, if you notch your signal in order to get a flat response, you might end up finally with a notch that isn´t quite as deep but I´m not an expert on room resonances...
As I said, the final tuning should be done by measurements.
Judging from your REW plot in post #32 your delta-f is ~10Hz as far as I can make that out.
You should put that into the spreadsheet (where do the 64,2Hz come from?).
To complicate things a little more, this circuit assumes an input source with 0R output resistance and the following amp with infinite resistance.
You will have to put in an Rload which represents the input resistance of your sub-amplifier.
Just add an "R" by pressing R, add GND by pressing G and wire after pressing F3 (in my windows version at least).
Also, if you notch your signal in order to get a flat response, you might end up finally with a notch that isn´t quite as deep but I´m not an expert on room resonances...
As I said, the final tuning should be done by measurements.
Attachments
Last edited:
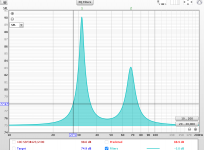
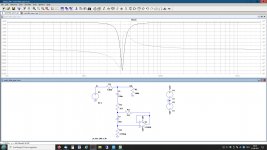
I think your delta-f is again somewhat wrong.
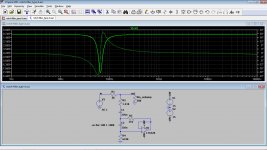
If you look at the peak at 31Hz (@~90dB) you "go down" 3dB.
At ~87dB the width of the notch is ~1.8Hz.
Putting this into the sheet and LTSpice I arrive at the attached plot.
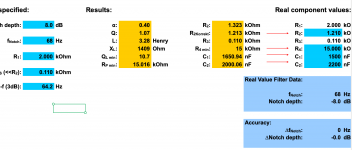
I put the following values in the sheet:
Notch depth=15dB, fnotch=31.8Hz, R1=4.02k, R3=511, delta-f=1.8Hz
If you look at the peak at 31Hz (@~90dB) you "go down" 3dB.
At ~87dB the width of the notch is ~1.8Hz.
Putting this into the sheet and LTSpice I arrive at the attached plot.
I put the following values in the sheet:
Notch depth=15dB, fnotch=31.8Hz, R1=4.02k, R3=511, delta-f=1.8Hz
Attachments
Last edited:
I think your delta-f is again somewhat wrong.
If you look at the peak at 31Hz (@~90dB) you "go down" 3dB.
At ~87dB the width of the notch is ~1.8Hz.
Putting this into the sheet and LTSpice I arrive at the attached plot.
I put the following values in the sheet:
Notch depth=15dB, fnotch=31.8Hz, R1=4.02k, R3=511, delta-f=1.8Hz
Ahh ok.
So delta-f on the spreadsheet is the 3 dB down point from the peak (15dB-3= 12dB point), not the -3dB from the base of the profile?
- Home
- Amplifiers
- Solid State
- +/- 12 V Power supply simple circuit?