Thanks for the advises!
The problem has become clearer now.
The trick is not made by the windowing/FFT/signal generator.
ARTA and YMEC (as analyzer/generator) behave equally, i.e.
As the result I think that board/its-driver does something extraordinary with bitness conversion (maybe during sample rate conversion if any) that produces below-signal-frequency artifacts.
The puzzle is what kind of bitness/sample-amplitude manipulations can make that on below-signal-frequency part only and why it’s revealed only on low FFT sizes
The problem has become clearer now.
The trick is not made by the windowing/FFT/signal generator.
ARTA and YMEC (as analyzer/generator) behave equally, i.e.
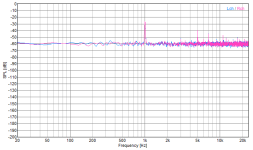
- 64k FFT shows symmetrical spectrum always in spite of the windowing
- various windowings beyond hanning can make the spectrum "worse" but still equal on the both analyzers. So the FFT/windowing implementation is not involved.
As the result I think that board/its-driver does something extraordinary with bitness conversion (maybe during sample rate conversion if any) that produces below-signal-frequency artifacts.
The puzzle is what kind of bitness/sample-amplitude manipulations can make that on below-signal-frequency part only and why it’s revealed only on low FFT sizes
Could it be because of a very low frequency artifact?
If the FFT period is below that frequency, on 64k size for instance, the artifact averages out to zero.
If FFT period is equal or above that frequency the "DC" shelf is displayed.
As the result the less FFT size, the higher FFT period, the higher shelf
If the FFT period is below that frequency, on 64k size for instance, the artifact averages out to zero.
If FFT period is equal or above that frequency the "DC" shelf is displayed.
As the result the less FFT size, the higher FFT period, the higher shelf
I suggest recording the output and compare it to the input signal, by this any artifacts (or dropped/repeated samples) would expose themselves immediately.
And I'd use REW (with WASAPI) as generator/analyzer (set generator frequency locked to exact FFT bin, otherwise short Hann windows will skirt like hell. Actually, you don't need any window with FFT bin center and synced-record-while-playback. If that doesn't give a narrow line, something is broken).
And I'd use REW (with WASAPI) as generator/analyzer (set generator frequency locked to exact FFT bin, otherwise short Hann windows will skirt like hell. Actually, you don't need any window with FFT bin center and synced-record-while-playback. If that doesn't give a narrow line, something is broken).

Ahm, there is very professional tool for than, DeltaWave, and astonishingly enough it is free-ware / donation-ware, just like equally the professional REW toolbox.Had to write a script to subtract one from another and amplify (+114 db) the difference.
I'd always look in the time domain data as well.
For example, when you have skipped or repeated samples which is an often used but cheating way of keeping stuff in sync you can identify that readily, whereas in the spectrum of the output or the residual you simply cannot see the simple error mechanism.
Maybe you could post the source and recorded files (pack them into a .ZIP, maybe after compressing them to lossless FLAC)?
Thanks! I will try.
The zip content
--diff.wav - difference = "--in" - "--out" +114 db amplified
--in.wav - the script processed zero cross stat/stop from in.wav
--out.wav - the script processed zero cross stat/stop from out.wav
in.wav - original IN
out.wav original OUT
The zip content
--diff.wav - difference = "--in" - "--out" +114 db amplified
--in.wav - the script processed zero cross stat/stop from in.wav
--out.wav - the script processed zero cross stat/stop from out.wav
in.wav - original IN
out.wav original OUT
Attachments
To check I2S loopback bit-perfection I use sox spectrogram, to view a clean sine generated e.g. by sox. The point is just a single sample once per many seconds can be missing or corrupted, and viewing FFT will not reveal it. E.g. this is a missing sample every ten secs (digital loopback where the USB-host driver did not honor implicit USB-async feedback correctly):

Another example e.g. https://forum.radxa.com/t/rock-pi-s-i2s0-anyone-getting-clean-96-192khz/20220/3 (glitching DMA transfer for I2S interface):

Sox spectrogram is extremely revealing - this is one 16th-bit flipped (using a hexa editor) in a 10-second 32-bit stereo wav:

Also for testing USB interfaces it's good to pick a frequency which does not place complete periods into USB frames (i.e. not using multiples of 1kHz) for which a dropped USB frame would produce no detectable discontinuity in the stream.
Another example e.g. https://forum.radxa.com/t/rock-pi-s-i2s0-anyone-getting-clean-96-192khz/20220/3 (glitching DMA transfer for I2S interface):
Sox spectrogram is extremely revealing - this is one 16th-bit flipped (using a hexa editor) in a 10-second 32-bit stereo wav:
Also for testing USB interfaces it's good to pick a frequency which does not place complete periods into USB frames (i.e. not using multiples of 1kHz) for which a dropped USB frame would produce no detectable discontinuity in the stream.
If it were a sample drop the spectrum would show wide-band side effects. Even on your screenshots it rather looks as while noise. Moreover it would hardly be FFT size dependent. I will check the hypothesis though. Anyway thank you for the tool I didn’t know before
I am not sure I understand. The X axis is time of the stream, not frequency as in an FFT chart. A single dropped sample on standard FFT will flicker and get overwritten by new FFT chart. Even if averaging is used, it will not be able to tell when/where in the stream the issue happened. Seeing the time dimension is important when checking for bit-stream perfection as it allows to relate the issue to its cause. E.g. the very regular interval of the issue on the first spectrogram directly suggested some regular buffer over/underflow was hapenning (in fact caused by overflows of the receiving buffer in the playback direction as the USB host was sending data too fast, due to ignoring the implicit feedback provided by the capture-direction stream).If it were a sample drop the spectrum would show wide-band side effects. Even on your screenshots it rather looks as while noise. Moreover it would hardly be FFT size dependent
Seeing frequency of the issues shown on the spectrogram helps when fine-tuning system params to minimize/avoid alltogether the issues (did a change make some improvement?)
Undoubtedly time domain checking is important and I will definitely do that (after the more priority experiments are exhausted)
Why I hardly at the moment think the samples dropping is my case relevant.
My unexplained “shelf” is low frequency only related and stable (for hours), gathered WAVs do not have sample drops as well.
Sample dropping causes momentary (not continuous) artifacts covers all the spectrum (vertical lines goes from bottom to the top)
All the changes I’ve made up to the moment didn’t help to understand the shelf reasons(did a change make some improvement?)
OK, I did not realize you want to solve the question of the alleged frequency dip.
Honestly, I do not see how your hardware could introduce that. The USB-I2S conversion chip does not document any internal DSP https://www.pawpaw.cn/media/documents/2022-12/SA9227A-20160624JP-v1.3.pdf, no sample format manipulation alone could do that. There is no SRC involved in the hardware.
But what playback/capture chain do you use? You mention REW - do you use one of the bit-perfect paths REW offers, i.e. e.g. wasapi exclusive in windows or linux alsa? Or does your chain involve some software resampling or even some DSP, e.g. in windows mixer (REW java nonexclusive), linux pulseaudio etc.?
There is no SRC involved in the hardware.
Looks like there is. The WAVs comparison hints at it.
Moreover SRC should be anyway. Input rate is determined by software. however physical rate can be arbitrary. Just in my case the rates are equal. But looks like SRC is applied as well.
But what playback/capture chain do you use?
ARTA (or REW or another sine generator)→ SA9227 windows driver→ USB → the board I2S output pins - > short dupont wires → the I2S input pins → USB → SA9227 driver → ARTA’s (or so) FFT
Did not try REW at the moment. But going to try, For now ARTA and YMEC.com analyzer behaves equally.
The shelf appears with WSAPI and Line modes equally.
No DSP involved at allOr does your chain involve some software resampling or even some DSP, e.g. in windows mixer
Maybe in software, but very unlikely (more or less certainly) not in the hardware.Looks like there is. The WAVs comparison hints at it.
The physical rate is controlled by the driver which is controlled by the software.Moreover SRC should be anyway. Input rate is determined by software. however physical rate can be arbitrary.
In arta WDM or asio? If WDM, then it's actually ARTA→ windows software audio mixer → SA9227 windows driverARTA (or REW or another sine generator)→ SA9227 windows driver
yesSA9227 windows driver→ USB → the board I2S output pins - > short dupont wires → the I2S input pins → USB → SA9227 driver
SA9227 windows driver→ ARTA’s (or so) FFT
Here as well SA9227 windows driver→ windows software audio mixer →ARTA’s FFT (unless used ASIO). Arta does not support wasapi exclusive.
What windows audio method does the YMEC.com analyzer use? IIUC there is no ASIO nor wasapi exclusive support (as the software seems to come from windows95, IIUC. Again - going through the windows mixer.For now ARTA and YMEC.com analyzer behaves equally.
Unless performed by the windows mixer.No DSP involved at all
IMO you should check your chain with REW through its wasapi exclusive interface, to bypass the windows mixer.
What I'm seeing in the data is this:

Subtraction does not work reliably as we don't know how the files align in time, a marker pulse (for example one single full-scale sample in a zero crossing of the source file) is required for exact alignment. When not time aligned we can only "shape align" by trimming to zero crossings but then the diff would show the dithering delta if we are off by any number of full periods.
If @SergeG could redo the test with a marker pulse in the input file so that the two files can be correctly time aligned we could hope for more insight from the diff. Ideally, it should be true zeros all the way... if not, some processing happened in between and most likely it happened in software**). As mentioned, it is mandatory to bypass the Windows audio mixer, either by using WASAPI exclusive or by using ASIO.
**) the input stream is fully saturated, max/min sample value is +/- 8388607 (2^23 - 1) which means there is no headroom left for re-dithering of the positive peaks and only 1 bit left for the negative peaks. That might explain the distortion.
I suggest not to saturate the input stream, give it a little headroom like 0.1dB or so to avoid these kind of problems.
- input and output files appear to have been mistaken, in is out and out is in
- (true) input file is clean, and properly dithered
- (true) output has some low level harmonic distortion -- which should not be there -- but is otherwise clean as well, there is definitely no syncing problem or the like. So that's the good news ;-)
Subtraction does not work reliably as we don't know how the files align in time, a marker pulse (for example one single full-scale sample in a zero crossing of the source file) is required for exact alignment. When not time aligned we can only "shape align" by trimming to zero crossings but then the diff would show the dithering delta if we are off by any number of full periods.
If @SergeG could redo the test with a marker pulse in the input file so that the two files can be correctly time aligned we could hope for more insight from the diff. Ideally, it should be true zeros all the way... if not, some processing happened in between and most likely it happened in software**). As mentioned, it is mandatory to bypass the Windows audio mixer, either by using WASAPI exclusive or by using ASIO.
**) the input stream is fully saturated, max/min sample value is +/- 8388607 (2^23 - 1) which means there is no headroom left for re-dithering of the positive peaks and only 1 bit left for the negative peaks. That might explain the distortion.
I suggest not to saturate the input stream, give it a little headroom like 0.1dB or so to avoid these kind of problems.
Yes, it seems.If so, FFT improper windowing is the only reason?
The only way I could provoke similar display to the ones shown in initial post is using way too short FFT size of 8k together with Hann window.
Showing the distortion-free input file to the loopback process (still named "out", maybe because it was named from I2S perspective) :
But the issue with the recorded file still is there, it should really be bit-identical to the source file when exactly time-aligned.
That's due to the main lobe width of the Hann window, it makes more sense if you look at the spectrum with a linear frequency axis. Hann is not suitable for high dynamic range FFT.The only way I could provoke similar display to the ones shown in initial post is using way too short FFT size of 8k together with Hann window
Here is my FFT of in.wav (256K points, Hann window, and 1/64K-octave filtering). It is showing a small amount of harmonic distortion.
Ed

Ed
Thank you! Actually REW shows the correct spectrum. I honestly didn’t expect such Hann windowing behavior. Actually it’s the first digital loopback I was testing. I never faced the problem with ADC/DAC measurements probably just because the analog loopback noise level is higher then the self level, so thought my measurements tools might be fine for digital loopback measurements as well, but they are not.
@KSTR Could you please tell me in connection with the in/out wav bits inequality. Could the difference be explained by an SRC in the path. I think that the input part of the adapter should include SRC as the adapter should accept any bitrate in spite of the software-side bitrate is fixed. Are observable distortion similar to typical SRC behavior?
@KSTR Could you please tell me in connection with the in/out wav bits inequality. Could the difference be explained by an SRC in the path. I think that the input part of the adapter should include SRC as the adapter should accept any bitrate in spite of the software-side bitrate is fixed. Are observable distortion similar to typical SRC behavior?
- Home
- Design & Build
- Equipment & Tools
- FFT of digital loopback