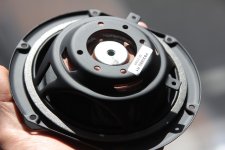
Thanks @Tenson for pointing me to your thread! very interesting!I wonder if this is similar to what I was curious about in this thread.
I have used a PR in a tested and measured as an active subwoofer. The problem was that SW and PR are side by side, so acoustic nearfield measurement is not reliable. It showed high level of "leakage" and distortion above 200Hz when tested without xo.
stv, can you make a test box where PR is on the backside? Also try to isolate main woofer's sound emission with some kind of extra baffle, a matrass or pile of pillows perhaps! Outdoors, preferably. 😎
stv, can you make a test box where PR is on the backside? Also try to isolate main woofer's sound emission with some kind of extra baffle, a matrass or pile of pillows perhaps! Outdoors, preferably. 😎
3 speakers and 14 ports - Test results
i used the three speakers as shown in post #688 and collected data with several different port variants.Attached (please scroll down to the end of this post!) is an overview with dimensioned drawings of ports, scale 1:2.
Not all port/enclosure combinations were possible or sensible, but there are ports that I used with different speakers, resulting in very different tuning frequencies. This will allow to correlate properties to the ports, independent from speaker/driver.
There is a strong correlation between compression and H3 distortion of ports, so I based the following graphs on compression.
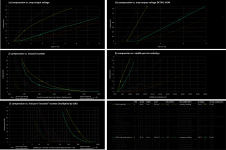
Here is an overview - still quite overwhelming:

The compression / input voltage graphs top left and right are obviously all over the place, because the very different port sizes and tuning frequencies.
As I mentioned yesterday there is something strange going on with the SONY woofer that compresses at LOW levels.
The "SONY 118 034 graph" is hard to interpret. I suppose the non-linear behaviour of this woofer gets stronger with very low tuning frequencies!
The compression / strouhal number graph (mid left) is more telling. Obviously the compression gets stronger with lower strouhal number.
The compression / middle port velocity graph shows low correlation between velocity and compression. In order to keep compression below 1 dB it seems sensible to keep the port velocity below 30 m/s. There are several ports that compress heavily already at very low velocities, however.
It took some time for me to understand that (as with strouhal number) there is a strong correlation between MID PORT STROUHAL NUMBER and compression (bottom left graph).
I defined the "mid port strouhal number" (MPSN) as follows:
MPSN = 100 * (smallest port radius / air displacement)
the multiplier by 100 is just there to make the numbers easier to read.
For rectangular ports the "virtual radius" is the radius of a circle with the same surface.
Obviously there will be a strong correlation between strouhal number (SN) and MPSN, follwing the correlation between port throat and mouth radius.
Here are two examples using the same port in different speakers, showing how close the MPSN and SN are related to the port:
1)
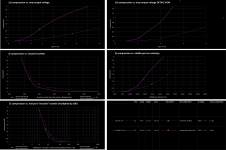
the "91 mm" port using the small SICA box (tuned to 77 Hz) and the bigger MONACOR box (tuned to 41,5 Hz).
Both the graphs for SN and MPSN are very similar. The MONACOR speaker is slightly better, as far as I have observed because of lower tuning.
2)
the "small slot" port and the (per port surface development and length) identical "small 3d" port, installed into the big SONY speaker (16 Hz) and the smaller MONACOR speaker (34,5 Hz).
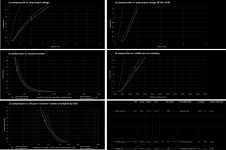
For the same port the strouhal and MPSN graphs are very close. The port velocity does not correlate for different tuning.
before diving into the grouping of port geometries here is an isolated graph overview with only the small crosses, showing where the ports start to make audible (turbulent) noise:
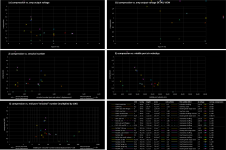
the table on the right bottom indicates what characteristic noise is starting to be audible. This follows my description of noise types in post #688.
Once more it shows that keeping the port velocity below 30 m/s is necessary to avoid noises, but depending on the port geometry nosie will start long before reaching that velocity level.
I will show four different groups of characteristic port behaviour regarding MPSN (another division based on strouhal numer comes next).
I am using a limit of about 1 dB as threshold for starting of compression. This is also the limit where majority of ports start to make audible noise.
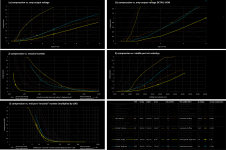
A) Low MPSN influence ports
compression starts very sudden at a MPSN<20.All these ports are long in relation to their minimum diameter. (L/Dmin > 6).
As I undestand the long port will provide a very steady laminar airflow, even for high displacements at the narrow port throat.
The flow is not disturbed by turbulent flow coming from the (flared) port ends.
The "big 3d" port shows that a low flare rate port will work fine even with very low strouhal numbers (as stated in the roozen paper, by the way).
B) Normal MPSN influence ports
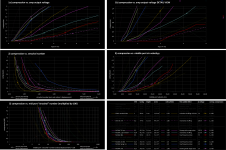
compression starts slightly more gradual with MPSN between 30 and 40.A light correlation to the strouhal number graph is evident for these ports.
most ports have a length/min-diameter ratio of 3-5. only exception is the rounded hole for the SONY woofer with a L/Dmin ratio of 0,53.
In my opoinion it is generally not advisable to make very short ports (hole in the box), because the laminar flow cannot build up.
C) Strong MPSN influence ports
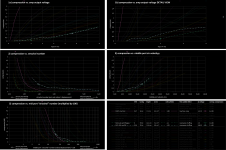
compression starts at high MPSN above 50.these ports have a similar L/Dmin-ratio of 3-4,5 but a high tuning frequency and/or very small throats.
There might be other influences that lead to this behaviour and maybe I will close this group once I know more about it!
D) Very low tuning ports with low MPSN influence
This is an interesting group, because it seems that for very low tuning frequencies and reasonable ports the compression issue is disappearing.I should add, that the absolute output level was quite low for these ports.
E) sharp edge turbulent flow ports
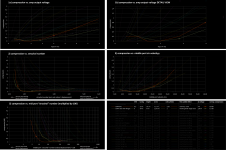
These ports start compressing due to sharp edges leading to turbulent flow:one is the simple SONY enclosure board cutout and the other one is the simple cardboard tube for the MONACOR.
the MPSN influence is neglible, because both ports have a straight geometry, thus the main compression factor is not the "mid port section" or, for the SONY there is none.
I guess it will be good to collect this information in a document - but I am happy for any comment or hint!
EDIT: NFR is the abbreviation for "normalized flare rate", see #526
Attachments
Last edited:
Comparing two different NFR ports (straight and rounded)
isolating two representative ports in my collection of graphs - the "BIG" very rounded NFR=0,5 port and the more straight "3d BIG" port with NFR=0,155: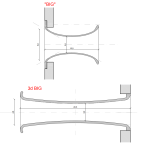
please note that these ports do NOT have the same tuning frequency. A NFR=0,155 port with the same tuning frequency as the "BIG" port would be much shorter!
here are the graphs:
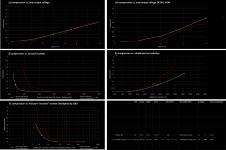
While the compression vs. input graphs have to be taken with a grain of salt, because of the different tuning, the general tendency is visible:
The more rounded port compresses less (or not at all) at low levels.
The more straight port compresses less at higher levels.
For more meaningful conclusions I'll have to make two ports with the same tuning!
Of course there is.there is no perfect port?
The research is necessary to know how big it needs to be.
And if you want a less perfect one, take the less curved one. It will compress and make noise, but still behave sort of all right.
The "perfect" one will not be so forgiving once you exceed the calculated limit.
In physics there is never a perfect?Of course there is.
The law of conservation of misery will always be there.
So it's always a set of compromises.
I was only teasing, didn't mean to imply all the work was a waste! 🙂Of course there is.
The research is necessary to know how big it needs to be.
And if you want a less perfect one, take the less curved one. It will compress and make noise, but still behave sort of all right.
The "perfect" one will not be so forgiving once you exceed the calculated limit.
Now we can more accurately know where that compression limit will be and design not to exceed it while getting the most from the low noise geometry.
Very interesting measurements! I'll try using strouhal values instead of port velocity.
I previously posted my port compression measurements here, and I have now calcuated strouhal numbers for the port opening and mid port.
Just to make sure I got it right:
Strouhal numbers:
1. Calculate equivalent single round port radius at the port exit (after flare): sqrt(port_exit_area/pi).
2. Air displacement: (port_velocity/(f*2*pi))
3. strouhal = equivalent_exit_radius / displacement
Mid port strouhal:
1. Calculate equivalent single round port radius of the smallest section of the port (in this case, in the middle) : sqrt(port_mid_area/pi).
2. Air displacement: (port_velocity/(f*2*pi))
3. MSPN = (equivalent_mid_radius / displacement)*100
I only included measurements at the tuning frequency the ports for now, so all data here is at 32.5 or 38.5 Hz.

Third order harmonic distortion is also listed here. Distortion at tuning does not seem to be much of an issue in my application.
THD minimum is very close to tuning, likely due to low excursion.
Here are some graphs:

Port compression (db) vs strouhal, for new (296mm² mid, 625 mm² exit) and old (163 mm² mid, 265 mm² exit)

Port compression vs mid port strouhal * 100.
As you can see, It looks like new port does compress more at the same strouhal value, however, driver thermal compression might be the cause of the difference... The new port needed much higher power levels to compress.
I made a very crude thermal compression guesstimate:
I took the sweep time before the measured frequency, eyeballed the average amplifier apparent load power in WinISD between the start of the sweep and Fb.
power*time = total energy into voice coil before measurement.
I used the compression data at 130Hz as a reference with no port compression, to make a linear regression of lost acoustic power (%) and energy absorbed by voice coil. This model was used calculate estimated thermal compression at the tuning frequency.
Yes, speakers are not 100% resistive loads, yes, cooling from excursion was not accounted for... I could list some more problems...
Here are the same graphs, but with guesstimated thermal compression removed:

It still looks like the new ports have more compression at the same strouhal value. This could be because my very crude estimate is off, but the new ports needed a 90 degree turn to fit in the box, it is not abrupt, but it probably still affects performance.
I previously posted my port compression measurements here, and I have now calcuated strouhal numbers for the port opening and mid port.
Just to make sure I got it right:
Strouhal numbers:
1. Calculate equivalent single round port radius at the port exit (after flare): sqrt(port_exit_area/pi).
2. Air displacement: (port_velocity/(f*2*pi))
3. strouhal = equivalent_exit_radius / displacement
Mid port strouhal:
1. Calculate equivalent single round port radius of the smallest section of the port (in this case, in the middle) : sqrt(port_mid_area/pi).
2. Air displacement: (port_velocity/(f*2*pi))
3. MSPN = (equivalent_mid_radius / displacement)*100
I only included measurements at the tuning frequency the ports for now, so all data here is at 32.5 or 38.5 Hz.
Third order harmonic distortion is also listed here. Distortion at tuning does not seem to be much of an issue in my application.
THD minimum is very close to tuning, likely due to low excursion.
Here are some graphs:
Port compression (db) vs strouhal, for new (296mm² mid, 625 mm² exit) and old (163 mm² mid, 265 mm² exit)
Port compression vs mid port strouhal * 100.
As you can see, It looks like new port does compress more at the same strouhal value, however, driver thermal compression might be the cause of the difference... The new port needed much higher power levels to compress.
I made a very crude thermal compression guesstimate:
I took the sweep time before the measured frequency, eyeballed the average amplifier apparent load power in WinISD between the start of the sweep and Fb.
power*time = total energy into voice coil before measurement.
I used the compression data at 130Hz as a reference with no port compression, to make a linear regression of lost acoustic power (%) and energy absorbed by voice coil. This model was used calculate estimated thermal compression at the tuning frequency.
Yes, speakers are not 100% resistive loads, yes, cooling from excursion was not accounted for... I could list some more problems...
Here are the same graphs, but with guesstimated thermal compression removed:
It still looks like the new ports have more compression at the same strouhal value. This could be because my very crude estimate is off, but the new ports needed a 90 degree turn to fit in the box, it is not abrupt, but it probably still affects performance.
Thank you very much @fufuheo - great to see some other results, but using drivers and voltages magnitudes bigger!!
The "compensated" graphs seem to match my results, at least for port exit strouhal number.
In your case the flaring rate (or max/min surface ratio) is not very strong, thus the exit diameter is not so much bigger than the middle port diameter.
Because of that the "MPSN" (or the mid port constriction) is not relevant for compression and the MPSN is still high at raising compression, caused by port exit turbulent flow.
The more straight geometry of the old port may be the reason for less compression (or lower acceptable strouhal number). This is in accordance with the roozen paper (philips) and also with my measurements.
Also, the laminar flow is probably affected by the 90 degree turn, which could also increase compression.
Again, thank you very much for posting your findings and relating compression to the strouhal parameters!
I made a mistake in the spreadsheet, I used the wrong area for the MSPN calculation, so it is based on the exit and not the mid area in the graphs. I could not find a way to edit my post, so I'm posting corrected MSPN data here.

MSPN vs compression

MSPN vs compression, (Estimated thermal compression removed)

After reading your data, MSPN of ~40 should be acceptable, so exit strohal is (as you said) probably still the main influence here. The port length/diameter is only ~2.8 here, using equivalent circular port, so a bit lower than the ports you measured.
I've come to the conclusion that it would be possible to decrease the mid port area here (provided same exit area) to 200cm² based on this criteria, MSPN = 40,6, velocity 47.5 m/s!!, which seems very high, I thought 32 m/s was quite high in the first place...
I'm not sure I got it this though...
MSPN vs compression
MSPN vs compression, (Estimated thermal compression removed)
After reading your data, MSPN of ~40 should be acceptable, so exit strohal is (as you said) probably still the main influence here. The port length/diameter is only ~2.8 here, using equivalent circular port, so a bit lower than the ports you measured.
I've come to the conclusion that it would be possible to decrease the mid port area here (provided same exit area) to 200cm² based on this criteria, MSPN = 40,6, velocity 47.5 m/s!!, which seems very high, I thought 32 m/s was quite high in the first place...
I'm not sure I got it this though...
I would not reduce the mid port surface very much, for low L/Dmin ratios the mid port strouhal number (MPSN, that's just how I call it) should not get too low. But slight reduction might be ok. The advantage is that the total size of the port will reduce significantly.it would be possible to decrease the mid port area here (provided same exit area) to 200cm² based on this criteria, MSPN = 40,6
The whole strouhal number concept seems quite clear to me, because we always need to address the transition from high velocity to stationary air at the direct port surface. If this transition happens through a very thin layer of air (using a very narrow port) there is of course more risk of turbulence., velocity 47.5 m/s!!, which seems very high, I thought 32 m/s was quite high in the first place...
Also, the displacement of air is relevant, in my simplified understanding there will be an air flow disruption related to air viscosity if the displacement gets too big, compared to the allowable "elastic air expansion".
That's also what I observed in my tests. The velocity itself is not correlated to compression, the displacement to radius ratio instead is very much correlated.
I guess y axis is compression, x axis is strouhal number and MPSN (see below)what are x- and y-axis labels in each graph?
I defined a "mid port strouhal number", MPSN (not MSPN), see here:What is MSPN?
https://www.diyaudio.com/community/...rbers-and-port-geometries.388264/post-7755603
It's similar to the port exit strouhal number, but related to the minimum diamerter section of the port and multiplied by 100 for easier number handling.
Yesterday I started to read this tread and went to bead after midnight because of it.
Thank you so much STV on all the effort and talent invested to analyses this subject . Fantastic read! 👍
If I might ask a question related to BR resonator and phase here that is puzzling me. Might be it is interesting for all, and if not; disregard please.
It is about these loudspeakers I built:
https://www.diyaudio.com/community/threads/beetlejuice-speakers.409269/post-7602196
The port noise is (good enough for me) solved issue on this design: you can see pictures in link above. BR tube is large , D = 124mm and extends between floor and speaker, in addition to rounding edges that increase port mouth a lot.
However I have this strong phase shift at about 270 Hz, now reading this tread I figured this could indeed be 1st port resonance? This below is measured approx 1m from woofer.
Was the phase studied here, many SPL graphs but no phase. In picture below it is obvious that big SPL wave (green) is direct result of rapid phase reversal (violet)
stv:s reply is spot on. y port compression (db), x = (strohal or MSPN).fufuheo, what are x- and y-axis labels in each graph?
What is MSPN?
Thank you for the explanation.I would not reduce the mid port surface very much, for low L/Dmin ratios the mid port strouhal number (MPSN, that's just how I call it) should not get too low. But slight reduction might be ok. The advantage is that the total size of the port will reduce significantly.
The whole strouhal number concept seems quite clear to me, because we always need to address the transition from high velocity to stationary air at the direct port surface. If this transition happens through a very thin layer of air (using a very narrow port) there is of course more risk of turbulence.
Also, the displacement of air is relevant, in my simplified understanding there will be an air flow disruption related to air viscosity if the displacement gets too big, compared to the allowable "elastic air expansion".
That's also what I observed in my tests. The velocity itself is not correlated to compression, the displacement to radius ratio instead is very much correlated.
Ok, so I guess there are three major factors that affect port compression.
Exit strouhal, MSPN, and absolute air displacement?
In most designs, exit strouhal is the limiting factor.
There is a lot of measurements to go through, I'm trying to make sense of them...
In some of your measurements, you seem to be getting significantly more compression at the same strouhal than I do. It looks like the compression/strohal varies quite a bit depending on the port design.
In the post investigating MSPN, how did you separate MSPN effects from exit strouhal, given the correlation of mid vs end port area.
if the port is around 63 cm long that would correspond to a 270 Hz wavelength:However I have this strong phase shift at about 270 Hz, now reading this tread I figured this could indeed be 1st port resonance?
speed of sound / (2 * tube length) = resonance frequency
340 m/s / (2 * 0,63 m) = 340 / 1,26 s = 270 1/s = 270 Hz
depending on the distance between port exit and driver that will result in a deep notch, similar to the one you measured.
a deep notch in frequency response always translates into a sudden phase shift. the two are inherently connected (considering a minimum phase system).
even a very deep notch is usually not very audible and most importantly, this notch will not be there (or not as trong) in a real listening situation, including reflected sound. There might however be a problem if there is a narrow peak of total sound energy at 270 Hz.
you could measure that with the microphone at your listening spot and with no or long gating times.
It's not really that important to provide both graphs - in other words you can look at either graph and know what's going on - but response graphs are easier to interpret for me 🙂Was the phase studied here, many SPL graphs but no phase.
you can see the effect of a port resonance for the total response in my measurements here.
- Home
- Loudspeakers
- Multi-Way
- Investigating port resonance absorbers and port geometries
