AP wins! 🙂 I recall I had to do a trick to get the graph posted above and maybe there the mistake hides... If I set the DAC as the output device in ARTA then it would follow the sampling rate of the input device and since this was set at 192kHz to allow a view at higher frequencies, then NOS was looking like oversampling. To force the DAC operate at 44,1kHz I fed it from audacity.
I am well served.Pretty much this is all. Let me know if there is anything else you want me to explain.
Thank you for the clear description. 😎
Enjoy the aural outcome.

George

I have the pleasure to see, touch, test and listen to this DAC for a little while 😎
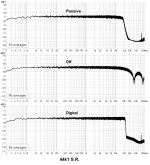
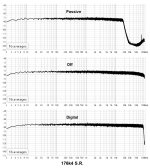
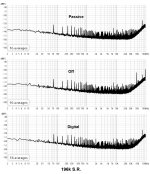
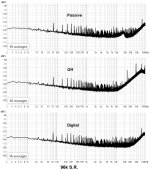
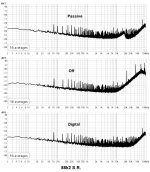
Here is the behaviour in freq. domain of the three modes of operation when DAC is fed with white noise at six different sampling rates.
"Passive" means PCM1794 NOS output in series with a 9th order Chebyshev LC filter (Abraxalito's Celibidache DAC passive filter).
"Off" means PCM1794 NOS output
"Digital" means PCM1794 oversampling digital filter output.
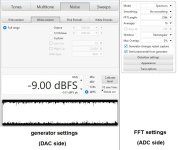
The DAC USB input is fed from a laptop PC and the DAC analog output is connected to an ADC which feeds another PC.
Both PCs are running REW, each set to the specific ASIO driver for the DAC and the ADC respectively.
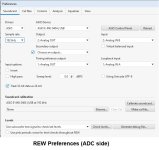
ADC is set to run at 192kHz 24bit.
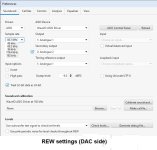
DAC is set to different sampling rates at 16bit
George
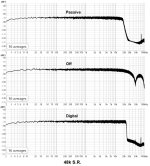
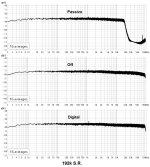
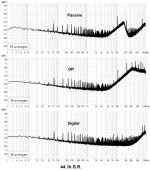
Here is the behaviour in freq. domain of the three modes of operation when DAC is fed with white noise at six different sampling rates.
"Passive" means PCM1794 NOS output in series with a 9th order Chebyshev LC filter (Abraxalito's Celibidache DAC passive filter).
"Off" means PCM1794 NOS output
"Digital" means PCM1794 oversampling digital filter output.
The DAC USB input is fed from a laptop PC and the DAC analog output is connected to an ADC which feeds another PC.
Both PCs are running REW, each set to the specific ASIO driver for the DAC and the ADC respectively.
ADC is set to run at 192kHz 24bit.
DAC is set to different sampling rates at 16bit
George
Attachments
-
 44k1_White noise-9dBFS - Copy.jpg181 KB · Views: 90
 -
 48k_White noise-9dBFS.jpg185.1 KB · Views: 88
 -
 88k2_White noise-9dBFS - Copy.jpg183.6 KB · Views: 84
 -
 96k_White noise-9dBFS - Copy.jpg182.3 KB · Views: 85
 -
 176k4_White noise-9dBFS - Copy.jpg182.4 KB · Views: 93
 -
 192k_White noise-9dBFS - Copy.jpg183.5 KB · Views: 86
 -
 Preferences ADC side.jpg69.3 KB · Views: 85
 -
 Preferences DAC side.jpg68.7 KB · Views: 76
 -
 Test Settings.jpg83.6 KB · Views: 87
Last edited:
H
HAYK
Very thankful for spoiling us with such generous efforts you accomplish, specially on Christmas day (orthodox).
Luckily you didn't use anti aliasing brick wall filter so we can see throughout the the DAC without filter.
Luckily you didn't use anti aliasing brick wall filter so we can see throughout the the DAC without filter.
George, thank you very much.
This is much better than I could do with one PC and Audacity to the rescue. @abraxalito 's filters are very consistent. "Passive" output is my default now. The biggest surprise is the behavior of the digital filter with rising sampling rate. I wasn't able to see that with my "method". Once again, great work!
This is much better than I could do with one PC and Audacity to the rescue. @abraxalito 's filters are very consistent. "Passive" output is my default now. The biggest surprise is the behavior of the digital filter with rising sampling rate. I wasn't able to see that with my "method". Once again, great work!
You are welcome Hayk and Kostas.
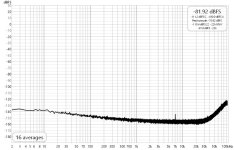
Now, using the same test setup, only reducing the test signal (white noise) to -100dBFS, I captured the noise skirt of the DAC output, up to ~100kHz.
The effect of the ADC's noise shaping (see last attachment) over all test FFT screenshots becomes obvious.
The spikes at 75Hz and it's harmonics are there, regardless of sampling rate change on both DAC and ADC, even use of one or two PCs or change of drivers.
George
Attachments
-
 (10) ADC_open input (192k_24bit).jpg102.7 KB · Views: 67
 -
 (9)Test Settings_-100dBFS.jpg84.9 KB · Views: 57
 -
 (8) Preferences DAC side.jpg68.7 KB · Views: 58
 -
 (7) Preferences ADC side.jpg69.3 KB · Views: 61
 -
 (6) 192k_White noise-100dBFS .jpg194.4 KB · Views: 58
 -
 (5) 176k4_White noise-100dBFS .jpg191.8 KB · Views: 54
 -
 (4) 96k_White noise-100dBFS .jpg192.8 KB · Views: 68
 -
 (3) 88k2_White noise-100dBFS .jpg194.5 KB · Views: 70
 -
 (2) 48k_White noise-100dBFS .jpg194.5 KB · Views: 63
 -
 (1) 44k1_White noise-100dBFS .jpg192.6 KB · Views: 63
The DAC is sigma-delta and it shows... Maybe it sounds so too, although I have not a remarkable back round with multi-bit.
The 75Hz spikes is a mystery. I'm happy to see they appear at this frequency in your tests. In my humble attempts they are at 100Hz and up like rectifiers' noise but in a completely shunt regulated psu. So, now I know it's something else. 👍
The 75Hz spikes is a mystery. I'm happy to see they appear at this frequency in your tests. In my humble attempts they are at 100Hz and up like rectifiers' noise but in a completely shunt regulated psu.
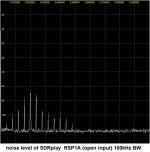
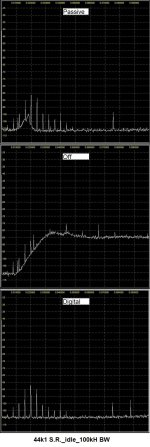
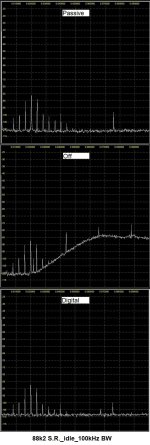
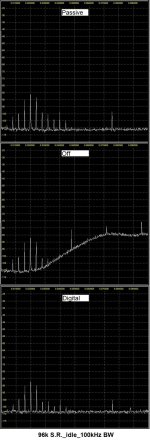
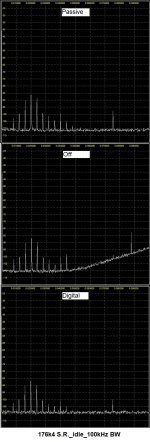
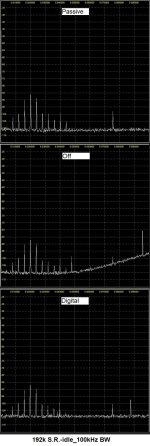
So, now I know it's something else. 👍I repeated the tests of post #47 (noise skirt of the DAC output, up to 100kHz), this time using an SDR insted the ADC of the soundcard.
Now the horizontal scale is linear.
The 4kHz apart spikes btb 8kHz and 48kHz are part of the SDR noise floor as seen in att (3)
Now the horizontal scale is linear.
The 4kHz apart spikes btb 8kHz and 48kHz are part of the SDR noise floor as seen in att (3)
Attachments
-
 (1) SDRplay RSP1A.JPG574.3 KB · Views: 61
 -
 (2) FFT settings.jpg93.1 KB · Views: 64
 -
 (3) 100kHz BW ambient.jpg94 KB · Views: 62
 -
 (4) 44k1_idle.jpg266.3 KB · Views: 63
 -
 (5) 48k_idle.jpg257.1 KB · Views: 60
 -
 (6) 88k2_idle.jpg264.6 KB · Views: 58
 -
 (7) 96k_idle.jpg264 KB · Views: 56
 -
 (8) 176k4_idle.jpg262.6 KB · Views: 60
 -
 (9) 192k_idle.jpg254.3 KB · Views: 58
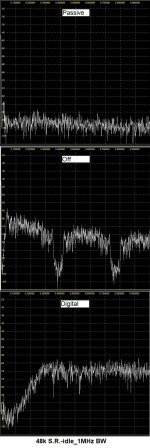
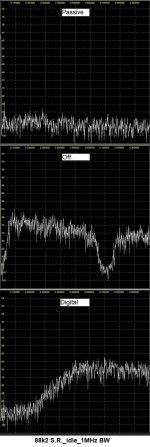
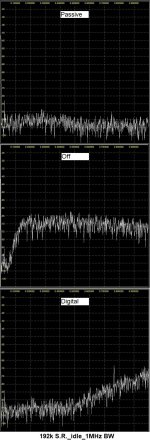
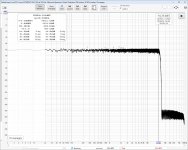
Same SDR. Noise skirt of the DAC output, up to 1MHz.
Attachments
-
 (1) FFT settings.jpg94.6 KB · Views: 54
 -
 (2) 1MHz BW ambient.jpg122.6 KB · Views: 57
 -
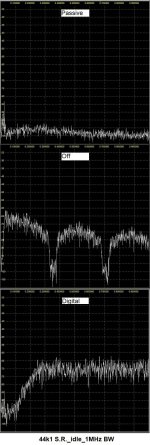 (3) 44k1_idle_1MHz BW.jpg265.4 KB · Views: 56
 -
 (4) 48k_idle_1MHz BW.jpg272.1 KB · Views: 53
 -
 (5) 88k2_idle_1MHz BW.jpg272.9 KB · Views: 55
 -
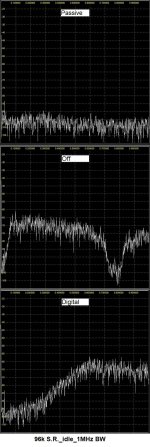 (6) 96k_idle_1MHz BW.jpg276 KB · Views: 58
 -
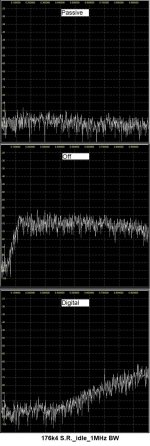 (7) 176k4_idle_1MHz BW.jpg274.9 KB · Views: 55
 -
 (8) 192k_idle_1MHz BW.jpg271.5 KB · Views: 55
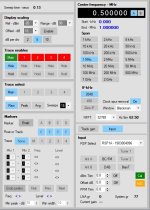
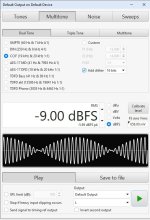
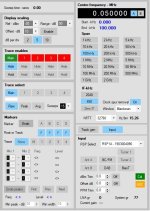
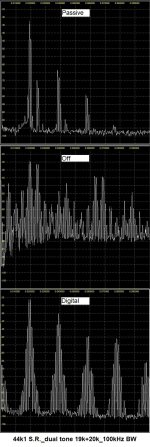
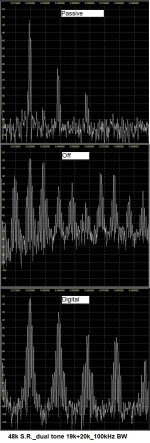
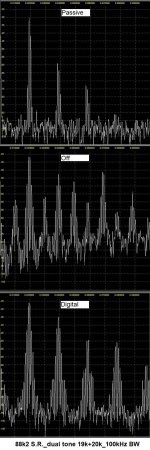
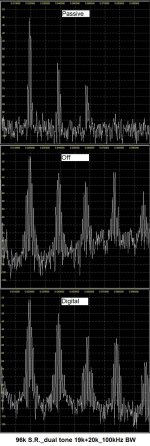
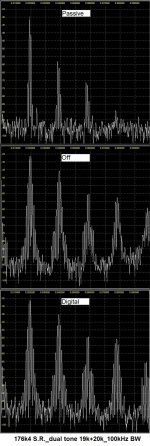
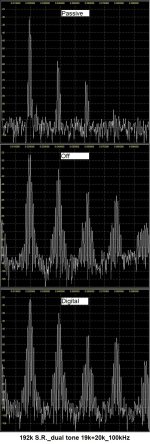
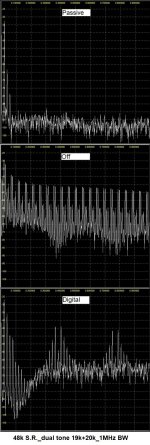
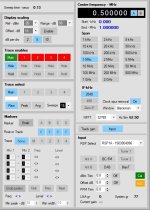
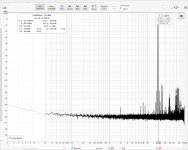
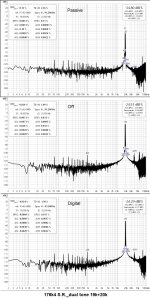
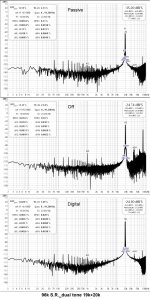
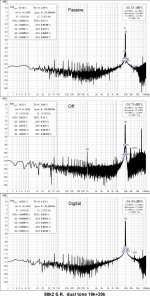
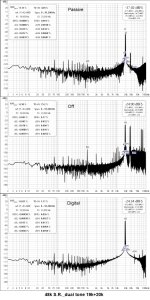
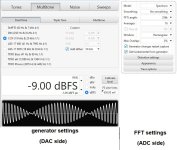
Now, after using the SDR dongle to test DAC in idle, I fed the DAC with 19kHz+20kHz 1:1
Here 0-100kHz BW FFTs
Here 0-100kHz BW FFTs
Attachments
-
 (1) dual tone settings.jpg89.1 KB · Views: 58
 -
 (2) FFT settings.jpg93.9 KB · Views: 56
 -
 (3) 44k1_19k+20k_100kHz BW.jpg275.6 KB · Views: 58
 -
 (4) 48k_19k+20k_100kHz BW.jpg288.2 KB · Views: 57
 -
 (5) 88k2_19k+20k_100kHz BW.jpg287.4 KB · Views: 55
 -
 (6) 96k_19k+20k_100kHz BW.jpg279.7 KB · Views: 53
 -
 (7) 176k4_19k+20k_100kHz BW.jpg288 KB · Views: 53
 -
 (8) 192k_19k+20k_100kHz BW.jpg288 KB · Views: 53
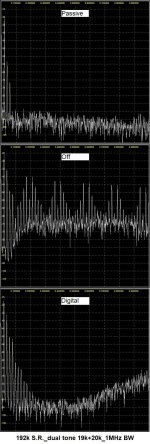
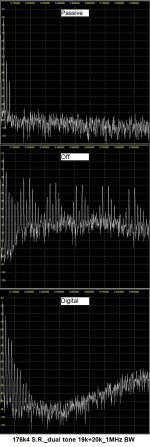
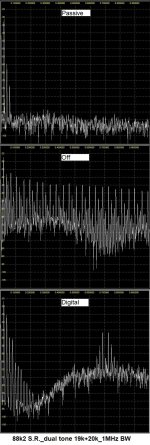
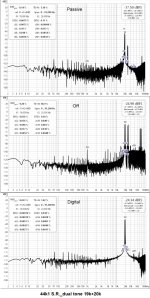
Here 0-1MHz BW FFTs
Attachments
-
 (8) 192k_19k+20k_1MHz BW.jpg287.6 KB · Views: 53
 -
 (7) 176k4_19k+20k_1MHz BW.jpg282 KB · Views: 57
 -
 (6) 96k_19k+20k_1MHz BW.jpg291 KB · Views: 55
 -
 (5) 88k2_19k+20k_1MHz BW.jpg283.6 KB · Views: 54
 -
 (4) 48k_19k+20k_1MHz BW.jpg288.2 KB · Views: 63
 -
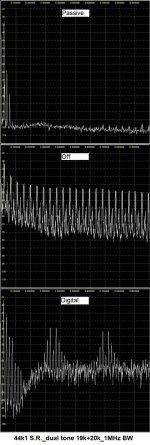 (3) 44k1_19k+20k_1MHz BW.jpg274 KB · Views: 54
 -
 (2) FFT settings.jpg93.5 KB · Views: 57
 -
 (1) dual tone settings.jpg89.1 KB · Views: 57
Last edited:
Wow! All the things I could never do myself. Thank you very much George!
I'll need to grasp all this. To my eyes, it appears that digital cannot be as fast as analog.
I'll need to grasp all this. To my eyes, it appears that digital cannot be as fast as analog.
Something odd about the PCM1794 digital filter and also about the SDRPlay measurements.
Here is my AK4493 at 44100Hz with sharp filter and CCIF -3dBFS. ADC is ES9822PRO. (Dismiss the distortion numbers as DAC and ADC used separate REW instances, so the numbers are for THD, not IMD).
Here is my AK4493 at 44100Hz with sharp filter and CCIF -3dBFS. ADC is ES9822PRO. (Dismiss the distortion numbers as DAC and ADC used separate REW instances, so the numbers are for THD, not IMD).
Attachments
Last edited:
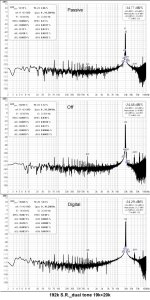
What I see Kostas is that the passive LC filter does a fine job in clearing the ultrasonic spectrum, better than the digital filter.
Not to speak about the unfiltered (NOS) clutter.
OK, speakers can't reproduce these, our ears can't hear these. But the electronic gear downstream the DAC may find it difficult to process the audio signal without intermodulation or even show signs of instability.
If we look at the 100kHz BW FFTs at post #52, with the unfiltered signal (Off) the area below 20kHz is full of high level spikes.
This is a hint that my SDR is a victim of intermodulation due to the unfiltered ultrasonic spectrum.
It is surprising but I have no other explanation.
What I could do was to repeat the test with my soundcard in place of the SDR
The attached soundcard FFTs do not show that severe IMD that the FFTs of the SDR show.
This is an (unintended) case of 'proof by example' 🙂
George
Attachments
-
 (6) 176k4_19k+20k-9dBFS.jpg368.2 KB · Views: 48
 -
 (5) 96k_19k+20k-9dBFS.jpg369.7 KB · Views: 53
 -
 (4) 88k2_19k+20k-9dBFS.jpg369.2 KB · Views: 53
 -
 (3) 48k_19k+20k-9dBFS.jpg371.1 KB · Views: 52
 -
 (2) 44k1_19k+20k-9dBFS.jpg368.7 KB · Views: 59
 -
 (1) Test Settings dual tone-9dBFS.jpg104.5 KB · Views: 54
 -
 (7) 192k_19k+20k-9dBFS.jpg369 KB · Views: 51
Sorry bohrok, I was uploading yesterday's work while you were posting.
Indeed it has to be the SDR was having a hard time with these signals.
I will see what happens to it if I attenuate the incoming signal.
George
Indeed it has to be the SDR was having a hard time with these signals.
I will see what happens to it if I attenuate the incoming signal.
George
I'm not sure that it is about the signals. In SDR 44k1 noise graph the digital filter output has a strange step rise in the noise floor although according to your previous ADC measurement the noise floor is quite flat upto 100kHz.
bohrok
I inserted a passive attenuator btnthe DAC out and SDR and FFTs are much cleaner.
I'll redo the whole set of SDR tests and attach the results here after some hours.
Thanks for commenting 🙂
George
I inserted a passive attenuator btnthe DAC out and SDR and FFTs are much cleaner.
I'll redo the whole set of SDR tests and attach the results here after some hours.
Thanks for commenting 🙂
George
When I read that claim, it caught my attention. Its usually better and more accurate to claim to have evidence rather than proof, except in the field of mathematics where a proof is possible.This is an (unintended) case of 'proof by example'
- Home
- Source & Line
- Digital Line Level
- NOS, Oversampling... and now Hybrid(?)