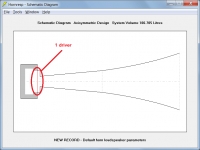
The locations of the acoustic centers, and resulting path distance between them is based on research described by John Vanderkooy in several AES papers. At low frequencies (baffle and driver are small relative to the wavelength) the source can be treated as a point. However, polar measurements indicate that this point source is not located at the driver cone but rather a distance in front of the baffle/driver. The distance to the acoustic center is mainly defined by the size of the baffle, but is also affected by the size of the driver, and the depth of the cabinet. The space it is radiating into also has an effect. Move the woofer from free space down to the floor and then up against the wall (4-Pi to 2-Pi to 1-Pi) and the acoustic centers move further and further out in front of the woofer or H-frame/U-frame opening.I'm wondering how this smallest path is calculated? Because I would think the sound has to travel around the baffle which would lead to a larger number?

More details and comparison between measurement and theory posted here:
https://www.diyaudio.com/community/threads/hornresp.119854/page-500#post-5923396
If you are interested in using U-frame as a cardioid you might find these posts helpful:
https://www.diyaudio.com/community/threads/hornresp.119854/post-6166811
https://www.diyaudio.com/community/threads/hornresp.119854/post-6172980
If interested in the AES papers they can be found here:
The Low-Frequency Acoustic Center: Measurement, Theory, and Application (2010)
https://www.aes.org/e-lib/browse.cfm?elib=15289
Applications of the Acoustic Centre (2007)
https://www.aes.org/e-lib/browse.cfm?elib=14087
The Acoustic Center: A New Concept for Loudspeakers at Low Frequencies (2006)
https://www.aes.org/e-lib/browse.cfm?elib=13746
Polar Plots for Low Frequencies: The Acoustic Centre (2006)
https://www.aes.org/e-lib/browse.cfm?elib=13588

The algorithm used is quite complicated - see the post linked below, and the other posts it references, for further information.
https://www.diyaudio.com/community/threads/hornresp.119854/page-523#post-6069923
More references to acoustic centres / centers are given here:
https://audioroundtable.com/forum/index.php?t=msg&th=16472
Thanks again for these interesting links!
Hi,
I played around with Hornresp and I get the idea that I'm getting more familiar with it. It is very nice to have this software for free and to be able to do so many simulations!
Tonight I simulated two H frame OB dipoles. I selected the SB17NAC35-8 driver and put it in a 20*20 cm = 400 cm^cm baffle. So for the first simulation in the Loudspeaker Wizard I inserted: S1=400 and L12=L56=10. (the baffle has side panels of 2*10=20cm total depth)
But there is one thing I don't understand: the first step is to open the Input Wizard via the Help menu and select the right options. After that I paste the driver into the Input Parameters screen and then I open the Loudspeaker Wizard to enter H frame dimensions (S1, L12, L56). After that I push Calculate in the Input Parameters Screen. Then I select Acoustical Power and from there I can select Tools => Multiple Speakers and select, for instance, 3S x 2P speakers. (6 drivers in total)
This is reflected in Max SPL graph. But when I go back to the Input Parameters screen, I still see S1=400 (cm^2). But there are 6 drivers now so I would expect to see an increased S1 of 6*400 = 2400.
So my question is: if one starts with one driver and S1=400, and after Calculating Acoustical Power selects 6 drivers in total, does the software automatically take into account (update) S1 as I don't see this update reflected in the Input Parameters screen?
By the way: there is also a "CH" input field at the right bottom side of the Input Parameters screen where I can insert the amount of drivers as well, for instance 3S x 2P. After that, it seems the software checks if S1 is bigger than the total speaker area. Is inserting multiple speakers in the CH box similar to the default CH=1 and selecting Mutiple speakers via the Tools => Multiple Speakers window?
I hope my question makes sense and I'm not making a mistake...
Then I select Acoustical Power and from there I can select Tools => Multiple Speakers and select, for instance, 3S x 2P speakers. (6 drivers in total)
This is reflected in Max SPL graph. But when I go back to the Input Parameters screen, I still see S1=400 (cm^2). But there are 6 drivers now so I would expect to see an increased S1 of 6*400 = 2400.
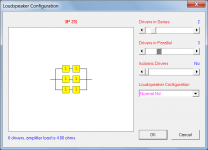
The Multiple Speakers tool specifies the number of loudspeakers in an array or stack, not the number of drivers in a loudspeaker. In Hornresp, a "speaker" (loudspeaker) is not the same as a "driver" (drive unit).
So my question is: if one starts with one driver and S1=400, and after Calculating Acoustical Power selects 6 drivers in total, does the software automatically take into account (update) S1 as I don't see this update reflected in the Input Parameters screen?
If multiple speakers are specified then the dimensions of each loudspeaker in the array do not change. If multiple drivers are specified then the user needs to make the loudspeaker large enough to accommodate them.
By the way: there is also a "CH" input field at the right bottom side of the Input Parameters screen where I can insert the amount of drivers as well, for instance 3S x 2P. After that, it seems the software checks if S1 is bigger than the total speaker area. Is inserting multiple speakers in the CH box similar to the default CH=1 and selecting Mutiple speakers via the Tools => Multiple Speakers window?
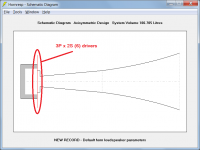
No, explained above, they are two different things. In this case you have specified multiple drivers, which is why the cautionary message appears. A visual indication is also given in the schematic diagram - the driver diaphragm as drawn increases in size as the number of drivers is increased.
Attachments
Last edited:
@David McBean: thanks again for the extensive help! The software was right with the terminology.
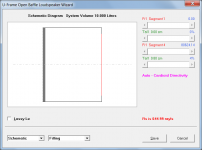
One other thing which is unlcear to me is the shape op the open baffle: when I insert S1=400 for a 20x20 cm baffle, it is a square shaped baffle. But what if I want to simulate a rectangular shaped baffle of lets say width=30 cm and height=20cm? Should I insert S1=600 or does this automatically translate to a sqrt 600 = 24,5x24,5 rectangle instead of a 20x30 rectangle? (I assume the shape of the baffle influences it's response)
One other thing which is unlcear to me is the shape op the open baffle: when I insert S1=400 for a 20x20 cm baffle, it is a square shaped baffle. But what if I want to simulate a rectangular shaped baffle of lets say width=30 cm and height=20cm? Should I insert S1=600 or does this automatically translate to a sqrt 600 = 24,5x24,5 rectangle instead of a 20x30 rectangle? (I assume the shape of the baffle influences it's response)
The answers are already in this thread.One other thing which is unlcear to me is the shape op the open baffle:
For baffle shape sims look at Edge/Basta
"For baffle shape sims look at Edge/Basta"? So that would mean Hornresp only supports square shaped baffles?
Thanks for your reply, did you mean:The answers are already in this thread.
"For baffle shape sims look at Edge/Basta"? So that would mean Hornresp only supports square shaped baffles?
Hornresp uses 1D axisymmetric modeling.So that would mean Hornresp only supports square shaped baffles?
So all pistons(and collections of pistons), all baffles, and crossections of all enclosure or horn segments are assumed to be circular.
For a given area, the shape of the baffle does influence the response and the SPL levels at LF.But what if I want to simulate a rectangular shaped baffle of lets say width=30 cm and height=20cm? Should I insert S1=600 or does this automatically translate to a sqrt 600 = 24,5x24,5 rectangle instead of a 20x30 rectangle? (I assume the shape of the baffle influences it's response)
For example a 40cm x 40cm baffle will result in higher SPL at LF than a 20cm x 80cm baffle for the same woofer and same baffle area.
To model the LF effect of a rectangular baffle, you need to account for this when defining baffle area in Hornresp. For a given area, the higher the aspect ratio of the rectangular baffle, the smaller the baffle area that should be used in Hornresp. As an example, the 20cm x 80cm baffle has an area of 1600cm^2 with an aspect ratio of 4. For proper prediction of LF SPL, you should use an area of 1600*0.49 = 784cm^2. You will notice that if the width of the baffle is held constant and height is increased, there is diminishing returns for increasing LF SPL.
*Factors were derived using BTM diffraction model mentioned below.
Remember that Hornresp is predicting the LF response using point sources placed at the acoustic centers in front and behind the baffle. Therefore, the response will only be valid up to the frequency where the point source assumption is no longer valid. This is defined by ka=1 for the radius of the baffle. It is identified in the pressure response plot with a transition from bold to light trace, and by a note at the bottom of the polar plot.

If you are interested in response above this frequency, you would need to use a diffraction simulator like Edge/Basta, VituixCAD, SoundEasy or similar. Those all use some form of geometric/ray tracing diffraction theory and you will find that although they work well at HF, they are only estimates of the diffraction at LF. The BTM diffraction model captures diffraction much more accurately, but I am not aware of any simulator other than LEAP that used it. It was mentioned here: https://secure.aes.org/forum/pubs/journal/?ID=276#1981 that a matlab tool is available from Peter Svensson upon request. I made my own spreadsheet based on the JASA paper and had posted some comparisons with measurements and EDGE here: https://www.diyaudio.com/community/...ion-with-dipole-radiation.267339/post-4249318
Last edited:
if the width of the baffle is held constant and height is increased, there is diminishing returns for increasing LF SPL.

Thats very useful thanks. I wonder how you derived the correction factor?
I had erred on the side of underestimating the SPL output with a stacked tower OB flat baffle with multiple woofers. I assumed the frequency response would be dominated by dipole cancellation from the most narrow path of least resistance to wave cancellation, when that path has an abundant length eg the y-axis of a rectangular baffle to act over. But your model is much more generous. Is the model assuming the driver is a point source?
Just to expand on the above, Hornresp models multiple drivers (i.e. a collection of pistons) as a single "composite" driver with the specified driver parameter values being adjusted accordingly internally by the program. For example, if Sd = 500 cm^2 for one driver then for 2S x 3P drivers the area of the circular composite diaphragm used in the simulation model is 500 x 2 x 3 = 3000 cm^2. (The values of Bl, Cms, Rms, Mmd, Le and Re are also adjusted accordingly).So all pistons(and collections of pistons), ... are assumed to be circular.
I'm starting to become more aware of radiation patterns only now even thought I built several electrostatic loudspeakers. I'm sorry if I post too many off-topic questions (not sure if I should start a new topic). But here is a new question:
I managed to find the Polar Directivity plot in Hornresp which is very nice to play with!
If I'm correct, my esl has a figure eight dipole radiation patern at 200-300 Hz. This will be the cross over frequency of my next project which will be a open baffle mid/woofer with a mid/high esl panel. So if I'm correct the mid/low speaker would ideally have a similar radiation pattern. So I would think an open baffle line array would be a good candidate.
I've read about a resisistive U-frame system optimised for cardiod directivity. I'm wondering what pros and cons such a radiation pattern have compared to a figure eight radiation pattern? Less rear reflections as a pro and more pressure at the sides of the loudspeaker (standing waves) as a con?
... as shown in the attached example.I've read about a resisistive U-frame system optimised for cardiod directivity.
Attachments
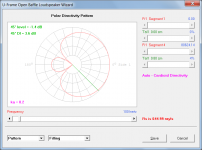
The pro is definitely the ability to minimize the impact of the first reflection off the wall behind the loudspeaker. I don't know that you could, in general, say that a cardioid has more room mode interaction than dipole. Most recent research papers seem to indicate that in general they have less overall room interaction except in very specific examples where dipoles are positioned and oriented to minimize a particular troublesome room mode. Of course, this location/orientation is seldom the best for integration with the rest of the loudspeaker. As far as integration between woofer and ESL, it would be more uniform if the radiation pattern was the same (ie dipole for both). Another con is the more complex build and tuning/measurement cycle required to achieve the desired cardioid response.I'm wondering what pros and cons such a radiation pattern have compared to a figure eight radiation pattern? Less rear reflections as a pro and more pressure at the sides of the loudspeaker (standing waves) as a con?
You may already be aware, Martin Logan uses cardioid bass on many of their models calling it "Force Forward". Some of their literature implied that the radiation pattern of the woofer is shifted from cardiod to dipole in the crossover frequency range for better integration with the ESL, but I am not sure if that is the case or not. Early models used passive networks to impart the needed delay between rear and front woofer, while more recent models that use built in amplifiers for driving the woofers implement the delay thru DSP; called "Powered Force Forward".
Attachments
Sorry for late reply, I had somehow missed your question.I wonder how you derived the correction factor?
I had erred on the side of underestimating the SPL output with a stacked tower OB flat baffle with multiple woofers. I assumed the frequency response would be dominated by dipole cancellation from the most narrow path of least resistance to wave cancellation, when that path has an abundant length eg the y-axis of a rectangular baffle to act over. But your model is much more generous. Is the model assuming the driver is a point source?
The correction factors were derived using the BTM diffraction method which is the only method I am aware of that is accurate at LF. If sources are distributed symmetrically on a baffle, there is surprisingly little variation going from a single point source to multiple woofers. As an example here is a comparison of a point source vs 1, 2, 3, or 4 woofers on a 20cm x 80cm rectangular baffle. You can see that below 400Hz there is remarkably little difference in the response.

Now sticking with the single woofer, here is how an equivalent circular baffle with correction factor compares. (Solid blue line vs Solid Red Line)
The dotted orange line shows that if you ignored the correction factor you would over predict the output at LF by about +3dB.
The dotted red line shows that if you sized the circular baffle just on the width of the rectangle you would under predict the output by about -3dB.
The dashed black line shows what Hornresp calculates with its point source dipole model. You can see that ka=1 is the point were response starts to diverge.

The correction factors were derived using the BTM diffraction method
Thanks for the great explanation and doing the sims to illustrate. You have a gift in making complex material easy to follow. Much appreciated.
Hi, I made a few simulations using the SB SB17NAC35-8 driver. Unfortunately the Hornresp data file corrupted, so I had to enter the driver data again.
I made simulations with flat baffles, U shaped and H shaped baffles. It seems the flat OB gives the best phase responses. For instance, when simulating a U shaped baffle of 20cm width and 10 cm depth I get this impulse response:

Compared to a 20 cm wide flat open baffle which has no ripples:

This is only the impulse repsonse, the other graphs differ as well. I'm wondering how to make a decision / preference based on these particular graphs. For instance, are the small ripples in the first graph a problem? The signal in the first graph takes more time to decay than the second one. Would this mean a better impulse response for the second graph?
(I tried to find some information about impulse responses, but the only thing I was able to find was that IR width in time should be as close to zero as possible)
I made simulations with flat baffles, U shaped and H shaped baffles. It seems the flat OB gives the best phase responses. For instance, when simulating a U shaped baffle of 20cm width and 10 cm depth I get this impulse response:
Compared to a 20 cm wide flat open baffle which has no ripples:
This is only the impulse repsonse, the other graphs differ as well. I'm wondering how to make a decision / preference based on these particular graphs. For instance, are the small ripples in the first graph a problem? The signal in the first graph takes more time to decay than the second one. Would this mean a better impulse response for the second graph?
(I tried to find some information about impulse responses, but the only thing I was able to find was that IR width in time should be as close to zero as possible)
Theres no need to manually enter driver data when, as advised, it may be possible to just download the file:
http://www.loudspeakerdatabase.com/SB/SB17NAC35
Most flat OB impulse hornresp, including with that SB looks clean like:

with minimal Group Delay

Repeats with a 3D baffle are revealing eg

The trade off is freq bass extension-SPL vs time domain.
It might be worth redoing your sims?
http://www.loudspeakerdatabase.com/SB/SB17NAC35
Most flat OB impulse hornresp, including with that SB looks clean like:
with minimal Group Delay
Repeats with a 3D baffle are revealing eg
The trade off is freq bass extension-SPL vs time domain.
It might be worth redoing your sims?
- Home
- Loudspeakers
- Planars & Exotics
- My newest pair of DIY electrostatic panels, advice needed