fluid, please make a sim with eg 400mm deep cabinet, so we can see the difference to 250mm deep. And perhaps round or triangle shape on the backside? Can you use an ideal radiator instead of one with specific response curve?
Here is Edge sim of 300x600mm baffle with "ideal" woofer effective width 200mm (resp WO24) BS peak is at 600Hz

Here is Edge sim of 300x600mm baffle with "ideal" woofer effective width 200mm (resp WO24) BS peak is at 600Hz
Looking at the bottom graph on p.9 of Linkwitz's pdf, this shows testing of a driver mounted on a cube with each dimension equal to 10.5 inches.This at first seems like a "smart" approach using logic, math, etc. Unfortunately the answer is completely wrong.
Like I posted above, see Linkwitz's pdf to get the value you are looking for. It's the upper plot on slide #9. Just read the SPL value right off of the plot at the halfway point of the baffle step response curve for any of the angles he has plotted.
baffle step frequency = 4560 inches/ 10.5 inches = 434 Hz.
At 390 Hz on the graph (approximately equal to the baffle step frequency), at 0 deg. on axis response equals 0 dB. At 180 deg., response equals -6 dB.
This shows that my calculation is in the ball park, off by 1.7 dB. My calculation is for what would ideally occur, that is, for a spherical enclosure, not a cube.
-Pete
Meanwhile here are some rippletank sims, which don't give nice graphs but show for example that the greatest null at the back shifts to another angle with the box depth.fluid, please make a sim with eg 400mm deep cabinet, so we can see the difference to 250mm deep. And perhaps round or triangle shape on the backside? Can you use an ideal radiator instead of one with specific response curve?
Here is Edge sim of 300x600mm baffle with "ideal" woofer effective width 200mm (resp WO24) BS peak is at 600Hz
These are 30cm baffle and ~20cm driver.
40cm deep, 2400Hz
40cm deep, 1200Hz
40cm deep, 600Hz
40cm deep, 300Hz
25cm deep, 2400Hz
25cm deep, 1200Hz
25cm deep, 600Hz
25cm deep, 300Hz
From these examples, it looks like less depth on the box turns the "nulls" more to sides than deeper box.
Pete, sound diffracts all around the box until attenuated enough, hence greatest attenuation at the back are to various directions behind the speaker depending on wavelength and not exactly 180 degrees, except perhaps on some particular wavelength. Long enough wavelength and no diffraction happens and no "null" or attenuation on the back. Note, even on the high frequencies there would be sound to back, as long as the transducer doesn't beam. I think I've read at some point at high enough frequencies sound would not diffract around corner, but I'm not sure if this is below 20kHz. Certainly we don't have transducers available that would radiate too much 20kHz to the sides, to the baffle edge. Here is 1" driver outputting 20kHz in ripple tank
Last edited:
fluid, please make a sim with eg 400mm deep cabinet, so we can see the difference to 250mm deep. And perhaps round or triangle shape on the backside? Can you use an ideal radiator instead of one with specific response curve?
Here is Edge sim of 300x600mm baffle with "ideal" woofer effective width 200mm (resp WO24) BS peak is at 600Hz
This was explored in Vineeth's 3 way design study thread starting here
https://www.diyaudio.com/community/threads/a-3-way-design-study.376620/post-6823063
200mm vs 400mm ideal pistons here
https://www.diyaudio.com/community/threads/a-3-way-design-study.376620/post-6831404
What would happen if you measure sound pressure level far field? Would this give you the same reading at angles in say the front half space? If 0 degrees is on axis in front of the driver, then measure SPL in the range of -90 deg. to +90 deg. far field. Is it possible that if the measurements are taken sufficiently distant from the driver, then all of the waves get mixed together to give an average reading?Meanwhile here are some rippletank sims, which don't give nice graphs but show for example that the greatest null at the back shifts to another angle with the box depth.
These are 30cm baffle and ~20cm driver.
40cm deep, 2400Hz
40cm deep, 1200Hz
40cm deep, 600Hz
40cm deep, 300Hz
25cm deep, 2400Hz
25cm deep, 1200Hz
25cm deep, 600Hz
25cm deep, 300Hz
From these examples, it looks like less depth on the box turns the "nulls" more to sides than deeper box.
Pete, sound diffracts all around the box until attenuated enough, hence greatest attenuation at the back are to various directions behind the speaker depending on wavelength and not exactly 180 degrees, except perhaps on some particular wavelength. Long enough wavelength and no diffraction happens and no "null" or attenuation on the back. Note, even on the high frequencies there would be sound to back, as long as the transducer doesn't beam. I think I've read at some point at high enough frequencies sound would not diffract around corner, but I'm not sure if this is below 20kHz. Certainly we don't have transducers available that would radiate too much 20kHz to the sides, to the baffle edge. Here is 1" driver outputting 20kHz in ripple tank
Especially woofers will beam in the audio frequency range. At what frequency beaming commences depends on the piston diameter of the woofer. When the driver starts to beam, then none of the wave by the driver interacts with the edges of the baffle. See 30 minutes into the talk by Linkwitz at Charlie Laub's post #13 in this thread,
Did you read the link I posted (post #10) ? It shows a measurement from a 300mm sphere from Olsens work.This shows that my calculation is in the ball park, off by 1.7 dB. My calculation is for what would ideally occur, that is, for a spherical enclosure, not a cube.
-Pete
Well we can argue about how far off you were. In a very first order approximation you are sort of correct. What I was trying to get you to see is that the place where the energy is "taken away" at half the baffle step is more at the +/-120 degree location and not the 180 degree location Your concept of the speaker only radiating to the front and rear is very naive. Even with a spherical enclosure the radiation pattern will at some frequency have peaks and nulls in it, and the first (lowest frequency) null(s) are not located directly to the rear. This web page from Monacor has some plots that show this well:Looking at the bottom graph on p.9 of Linkwitz's pdf, this shows testing of a driver mounted on a cube with each dimension equal to 10.5 inches.
baffle step frequency = 4560 inches/ 10.5 inches = 434 Hz.
At 390 Hz on the graph (approximately equal to the baffle step frequency), at 0 deg. on axis response equals 0 dB. At 180 deg., response equals -6 dB.
This shows that my calculation is in the ball park, off by 1.7 dB. My calculation is for what would ideally occur, that is, for a spherical enclosure, not a cube.
-Pete
https://www.monacor.com/magazine/directivity-pattern
I didn't look at it now because I first saw it several years ago. Figure 1 I believe only shows a SPL measurement taken on axis directly in front of the driver. There is no information there about what SPL is behind the driver. Rod is showing SPL differently from the way that I've considered it. At Figure 1 of Rod's article, 0 dB occurs when the driver on the sphere is radiating only into the front hemisphere. In my post #16 above, I take 0 dB to be the SPL when the driver on the sphere is radiating full space.Did you read the link I posted (post #10) ? It shows a measurement from a 300mm sphere from Olsens work.
Ok, I think you've got to the point where you need to build a test box and measure for yourself.I didn't look at it now because I first saw it several years ago. Figure 1 I believe only shows a SPL measurement taken on axis directly in front of the driver. There is no information there about what SPL is behind the driver. Rod is showing SPL differently from the way that I've considered it. At Figure 1 of Rod's article, 0 dB occurs when the driver on the sphere is radiating only into the front hemisphere. In my post #16 above, I take 0 dB to be the SPL when the driver on the sphere is radiating full space.
Cheers,
Rob.
In my post #5 I suggested looking at measurements done with Klippel NFS... Sadly most speakers are bass-reflex with port on the backside. Anyway, the basics of radiation are well coverd in previous posts and sources for more information are given several times.
cT equals piD, perhaps you must study these yourself or measure yourself, if our answers are not adequate.
I am still left wondering, why are you so interested in spl at 180deg of a loudspeaker? Why not the whole sphere?
cT equals piD, perhaps you must study these yourself or measure yourself, if our answers are not adequate.
I am still left wondering, why are you so interested in spl at 180deg of a loudspeaker? Why not the whole sphere?
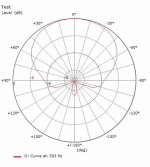
Here is a simple AKABAK BEM sim to show the attenuation around the speaker vs freq. The driver axis is at 0deg and will always be 0dB (normalized) in the polar coordinate plots to allow seeing the relative attenuation that occurs around this speaker (on 3m circle).
A more accurate prediction requires the actual box dimensions, rounding, and driver size and location.
.
A more accurate prediction requires the actual box dimensions, rounding, and driver size and location.
.
Attachments
-
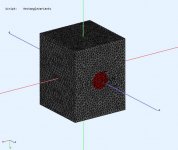 MonopoleRectangle.jpg43.5 KB · Views: 62
 -
 SPL@3mOnAxis.jpg22.9 KB · Views: 71
 -
 HpolarNormalized0Deg@3m.jpg25.2 KB · Views: 60
 -
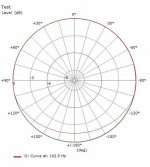 PolarCoord@102HZ.jpg20.2 KB · Views: 62
 -
 PolarCoord@206HZ.jpg20.4 KB · Views: 67
 -
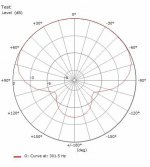 PolarCoord@302HZ.jpg20.2 KB · Views: 65
 -
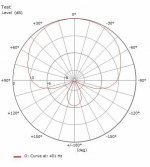 PolarCoord@402HZ.jpg20.3 KB · Views: 62
 -
 PolarCoord@502HZ.jpg20.1 KB · Views: 69
 -
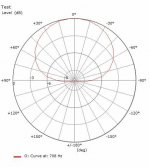 PolarCoord@703HZ.jpg19.9 KB · Views: 74
 -
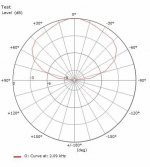 PolarCoord@2KHZ.jpg20.2 KB · Views: 70
What is the baffle step frequency of that simulation?Here is a simple AKABAK BEM sim to show the attenuation around the speaker vs freq. The driver axis is at 0deg and will always be 0dB (normalized) in the polar coordinate plots to allow seeing the relative attenuation that occurs around this speaker (on 3m circle).
A more accurate prediction requires the actual box dimensions, rounding, and driver size and location.
.
I don't view the radiation transition from 4Pi to 2Pi space as having "a" step freq. At first I was inclined to view it as a filter and look for the -3dB points but the transition slope changes depending on a number of factors, so we'll use something else. Is there a definition that you are using?
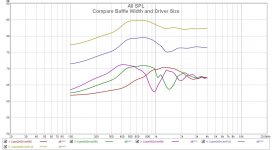
Using pic#2 (axial SPL) in my previous post, It has the 6dB transiton (4Pi to 2Pi space) as well as overshoot and undershoot caused by diffraction (lets ignore those for now). So for this example (previous post) lets say the transition ends at ~400Hz [edit - excluding the diffraction], if you wanted a single freq. to describe it.
The pic below is for various combinations of driver diameters and baffle widths to show the effect.
Attachments
Last edited:
From John Murphy (trueaudio.com),I don't view the radiation transition from 4Pi to 2Pi space as having "a" step freq. At first I was inclined to view it as a filter and look for the -3dB points but the transition slope changes depending on a number of factors, so we'll use something else. Is there a definition that you are using?
Using pic#2 (axial SPL) in my previous post, It has the 6dB transiton (4Pi to 2Pi space) as well as overshoot and undershoot caused by diffraction (lets ignore those for now). So for this example (previous post) lets say the transition ends at ~400Hz [edit - excluding the diffraction], if you wanted a single freq. to describe it.
The pic below is for various combinations of driver diameters and baffle widths to show the effect.
f3 = 380 / Wb
where
f3 = the baffle step frequency
Wb = baffle width in feet
This is based on measured frequency response of a spherical enclosure for a driver, and the diameter of the sphere is 2 feet. For this system, there is a 3 dB increase measured on axis in front of the system at 190 Hz, relative to 0 dB at 20 Hz.
I think that I do correctly recollect that Linkwitz in his presentation at the Burning Amp 2017 states that he doesn't think that the diffraction simulations are very accurate. See post #13 in this thread.
Regards,
Pete
I compare many of my design simulations against actual builds. I find 3D acoustic BEM sims very insightful and accurate. This is as much as I can provide to help answer your question. The frequency (or wavelength) dependent pressure around the cabinet depends on a number of variables that require a 3D simulator (BEM or FEM) to predict. Your equation is 1D, and some calculators are 2D.
It depends on the definition of "baffle step frequency". We had to wait until post #34 to read what you mean with it...What is the baffle step frequency of that simulation?
Seems like John Murphy has chosen +3dB (f3) to present that. I haven't seen that definition earlier, and I don't believe that it has any meaning IRL. We know the nature of "baffle step" and sims and measurements tell how spl response around a loudspeaker varies depending on various parameters, baffle dimensions being only one of the (but the major). Typically it takes 3-5 octaves to gradually develop from 0 to +6dB (peak often at +8dB)
Thank you DonVK for the best "answer" so far! Posts 31 and 33, definitive!
Thanks @Juhazi
Nothing wrong with estimating the forward looking step or diffraction from 1D or 2D methods. The OP asked for the radiation at the back of the speaker and that answer is only possible in 3D, and will get more accurate with more cabinet and driver details.
I'm curious as to why the OP wants this information. It would be interesting to actively cancel the rear radiation and reduce the side radiation at the same time.
Last edited:
That formula is a reasonable approximation, but it is just that, an approximation.From John Murphy (trueaudio.com),
f3 = 380 / Wb
where
f3 = the baffle step frequency
Wb = baffle width in feet
This is based on measured frequency response of a spherical enclosure for a driver, and the diameter of the sphere is 2 feet. For this system, there is a 3 dB increase measured on axis in front of the system at 190 Hz, relative to 0 dB at 20 Hz.
I think that I do correctly recollect that Linkwitz in his presentation at the Burning Amp 2017 states that he doesn't think that the diffraction simulations are very accurate. See post #13 in this thread.
Regards,
Pete
The formula would seem to indicate that all baffles which are 10 inches wide would have have the same baffle step frequency... but there is a big difference in a baffle step behavior between a speaker which is 14" H x 10" W and one which is 75" H x 10" W.
It is very possible that diffraction simulation has improved significantly since 2017. Weather forecasting has improved significantly in the 21st century; I would attribute that to computer simulation. Weather systems are just as complex as diffraction I guess.I compare many of my design simulations against actual builds. I find 3D acoustic BEM sims very insightful and accurate. This is as much as I can provide to help answer your question. The frequency (or wavelength) dependent pressure around the cabinet depends on a number of variables that require a 3D simulator (BEM or FEM) to predict. Your equation is 1D, and some calculators are 2D.
If the closed- box test enclosure of a driver is a sphere,then diffraction in both the horizontal and vertical planes would be the same I think.
Thanks,
Pete
I agree. The purpose of the approximation is to derive a baffle step compensation circuit. A compensating circuit accurately adjusting for the cabinet of a loudspeaker system that isn't a sphere would be very involved.That formula is a reasonable approximation, but it is just that, an approximation.
The formula would seem to indicate that all baffles which are 10 inches wide would have have the same baffle step frequency... but there is a big difference in a baffle step behavior between a speaker which is 14" H x 10" W and one which is 75" H x 10" W.
- Home
- Loudspeakers
- Multi-Way
- relative SPL front and back of a speaker at the baffle step frequency